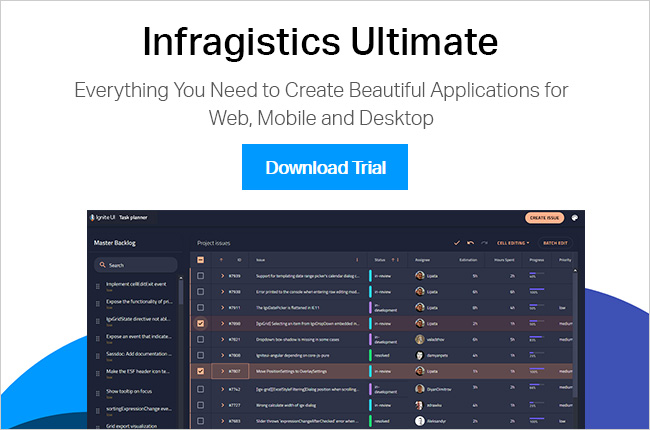
Our semi-annual release of our Infragistics Ultimate 18.1 development suite is upon us, and it is loaded with features that are modernizing user experience and UI tooling. With optimization and performance in mind, we've included updates to our .NET, JavaScript, and HTML5 data grids and chart components, user-friendly functionalities for our Angular data grid, and robust Microsoft Excel-style spreadsheet solutions for .NET and JavaScript.
Keep reading for the details for this release and links to the What's New blogs for each platform!
Fastest Angular Grid and Angular Charts
With 18.1, you'll benefit from the market-leading performance you've come to expect from Infragistics in both our Angular Data Grid and our Angular Chart. The grid benefits from both column and row based virtualization, giving you desktop-like scrolling performance for any number of rows or columns in the Grid. In the Angular Chart, we've optimized our canvas-based chart renderer for Angular, giving you multi-million data point renders in millisecond timeframes - all with smooth zooming & panning with the mouse or touch on mobile devices. Experience this awesome performance yourself in the Angular Grid and Angular Chart samples!
Along with the great performance, you'll also appreciate all of the new features we've added to the grid as well, including Column & Row virtualization, Paging, Column level support for Filtering, Sorting, Summaries, Pinning, Hiding, Resizing, grid level Filtering, Row Selection / Select All, Export to Excel (XLSX, CSV, TSV), and a whole lot more.
Image may be NSFW. Clik here to view.
Check out the What's New blog to learn about all of the new features and capabilities we're shipping in 18.1 for Angular.
Interactive, Real-Time Financial Charting
The new Financial Chart control for WPF, JavaScript and Angular gives developers a complete financial analysis charting tool with single line of code. A built-in toolbar gives one-click access to Bollinger Bands and Price Channel overlays, over 25 built-in Financial Indicators, over a dozen Trend Line options, multiple Chart Types & Volume Indicators – all preset in a convenient toolbar with built in time-based filtering.
Image may be NSFW. Clik here to view.
To learn more about the charts, head over to either of our What's New Blogs for Ignite UI and Ultimate UI for WPF.
Excel and Spreadsheet Solutions for .NET and JavaScript
With extensive updates to our Excel Library component, now with over 300 supported Excel functions, support for conditional formatting, table sorting & filtering and Worksheet sorting & filtering, you can manipulate your Microsoft Excel data without ever needing Microsoft Excel installed on your desktop or server! With these improvements, we've added new interaction menus and custom dialogs to the JavaScript Spreadsheet & WPF Spreadsheet controls. You can now interactively Filter, Sort, Format Cells, add Conditional Formatting and more with built-in menus on the Spreadsheet.
Ignite UI for JavaScript and Ignite UI for Angular pack a punch with best-of-breed components designed to be the optimal choice for any Capital Market application for JavaScript and native Angular. Featuring support for OpenFin OS, an increasingly popular alternative to modernize financial desktops and enable instant distribution across multiple device types. These top performing, easy-to-use, data grids and financial charts are built to be the backbone of high-performance, high-volume data applications.
Ignite UI for Angular now boasts the fastest Angular Data Grid & Angular Chart components on the market. In addition, our Angular toolkit has expanded to 50+ Material-based components. Ignite UI subscribers have a commercial license for our JavaScript and Angular components.
Let's get into the details about what's new.
JavaScript and Angular Get Financial Charts
With the Financial Chart for JavaScript and Angular, igFinancialChart and igxFinancialChartrespectively, users are offered a lightweight and high-performance solution for displaying financial data with web applications. It's boasting an intuitive and easy-to-use API, as the chart function offers multiple ways in which a user can display or visualize financial data. Essentially, it helps you easily bind your data or data collections, and then it will automatically analyze and select data columns for you. It’ll go ahead and use the Date and Time columns for the x-axis, and the y-axis will be dedicated to Open, High, Low, Close, and Volume. If you don’t have y-axis columns specifically dedicated to those titles, it’ll then pick the first five numeric columns. Furthermore, you can choose while chart types to employ for your data, with options like Bar, Candle, Column, and Line.
Image may be NSFW. Clik here to view.
JQuery Candle Chart
Image may be NSFW. Clik here to view.
Angular Candle Chart
JavaScript's Excel Engine Features and Spreadsheet Support
Moving from the Financial Charts, Ignite UI for JavaScript has had updates to its Excel engine with now over a hundred supported functions for the engine and spreadsheets. One significant feature of the update is the addition of Conditional Formatting, allowing you to apply formatting like colors, icons, and data bars to one or more cells based on the cell value. On top of the Conditional formatting, there's also the new Advanced Dialog filter that makes the filtering of specific data much more manageable.
Image may be NSFW. Clik here to view.
Conditional Formatting
Image may be NSFW. Clik here to view.
Example of Date Filters
Angular's Updated Data Grid and Chart Components
We're proud to continually provide developers with the best Data Grid components on the market, and our additions with this release are offering a variety of capabilities to improve the user experience. While you can extensively read about the updates for Angular in the blog post, "What's New in 18.1: Ignite UI for Angular", we do want to highlight a major component that was included in this release: The Category Chart. This component simplifies the complexities of the data visualization domain into an uncomplicated API. You can effortlessly bind a collection of data, or even a collection of collections, and let Category Chart do the rest. It’ll analyze your data and then automatically select the best series for the data’s representation. You can see the sample of the Category Chart and be mindful that the Grid updates are also here to help. Some notable components of the Data Grid are Column Pinning, Column Resizing, and Export to Excel, and you can glance through the list of components to learn even more.
Image may be NSFW. Clik here to view.
Our goal is to help you boost user experience and your productivity when it comes to web application development. Want to check out the new features for yourself? You can jump-start trying out our Ignite UI suite with a free trial or update your current subscription. Lastly, check out the @Infragistics Twitter page and if you have a request for a future product update, submit it at the Product Ideas page.
With today's release, Ignite UI for Angular includes 50-plus best-of-breed Material based components – now with the fastest data grid & charting available. Optimized for performance and detail level control, all Angular components can handle large datasets smoothly with Infragistics Virtualization directive and are easily branded or themed through an intuitive API.
Ignite UI’s Angular Data Grid has added several features including paging, header, cell and footer templates, editing cells directly or through a dialog box, column pinning, hiding, movable columns, column summarization, advanced sorting and filtering, and exporting to Excel, CSV, and TSV files.
New Angular Chart components include the lightweight, high-performance Financial Chart, and Category Chart. Display data in one of many chart types, including; line, area, column point, spline, step, waterfall and more.
Furthermore, our Ignite UI for Angular CLI tool is providing an open-source, no-code solution for developers working within the command line. It allows for easy, industry standard scaffolding of necessary application files, importing of often used modules for quick building, and worry-free installation of necessary project dependencies.
Let’s look at the host of updates to Ignite UI for Angular. If you'd like to just jump ahead and start trying it out for yourself, download our Ignite UI for Angular trial.
Grids and Lists
Now, let’s focus on some of our flagship updates for this release: the new capabilities with our Grid components. You’ll be pleased to see that we’ve incorporated a slew of features with our igxGrid component, and you can read about all of them on the components page.
Column Pinning
With column pinning, we’ve now allowed users to pin a single column or multiple columns to the left-hand side of the grid. With the columns pinned in this fashion, a user will be able to see those specific columns all the time while horizontally scrolling, and it serves as a great way to keep track of the data that you’re viewing.
Image may be NSFW. Clik here to view.
Column Resizing
On top of pinning, we’ve added deferred column resizing with igxColumnResizing. This neat feature incorporates a delayed update, meaning that it shows the user a temporary resize indicator while the drag operation is in effect. The new column size is then only put in place once the drag operation ends.
Image may be NSFW. Clik here to view.
Export to Excel/CSV/TSV
Moving forward, users can export their grid data into the format of their choosing: Excel, CSV, and TSV. So, if you’re looking to edit offline or you need to do some offline presenting, the export function for igxGrid is now your go-to operation.
Image may be NSFW. Clik here to view.
Summaries
Continuing with featured components, there has now been a summaries section added to the grid. Summaries are an excellent way to quickly see column data, as they display default information about the column in a separate container. Given the data type in the column, the summaries in the container will change, and it’s helpful to note that each summary is on a per-column level.
Image may be NSFW. Clik here to view.
Row Selection
The last highlighted addition to the grid rests with the row selection feature. The grid now supports the selection of one or multiple rows through a checkbox that precedes all the other columns in the row. This makes it easy for a user to select and to deselect specific rows.
Image may be NSFW. Clik here to view.
Editors
So, now leaping beyond our grid attributes, we’ll move into our new grid editors. In Ignite UI for Angular, our grid component provides the ability for users to edit the data it displays through inline editors in the grid cells and through editing dialogs that will spawn. Accordingly, we have two editors to present with this 18.1 update, and you can view the whole list of editors.
Mask Directive
The igxMask directive is providing the developer the means to control user input and to format the visible value based on configurable mask rules. It’s touted as very easy to use and to configure, providing different input options. The example below demonstrates a simple personal data form.
Image may be NSFW. Clik here to view.
Input Groups
Speaking about input groups, it’s an excellent time to discuss our refactoring of igxInputGroup. We went ahead and decided to ease the user experience of inputting data, so we added new input groups to our controls. This is allowing developers to craft easy-to-use, good-looking forms and, to boot, ones that handle validation and errors really well. In the examples, you can see both “Line Style Input” and “Border Style Input”:
Image may be NSFW. Clik here to view.
Image may be NSFW. Clik here to view.
Theming
We had one addition to our Styles & Themes category, and that is the recent theming mechanism. Mainly, we developed a new mechanism through SASS that enables another intuitive API for changing the theming of your various components. Our team designed it so that users only need to account for a few lines of code to style according to their needs. Handily, you can restyle one component, multiple components, or change the styling of the entire suite.
Image may be NSFW. Clik here to view.
Toggle
In our “Interactions” section, we brought to you the much needed igxToggle directive. On a basic level, this allows users interactivity in opening, animating, and closing a toggle container. The rest of igxToggle allows for the implementation of toggle-based components and views, like a drop-down, while igxToggleAction controls all of the other “toggleable” components.
Image may be NSFW. Clik here to view.Image may be NSFW. Clik here to view.
Tabs
Within our Layouts section, we’ve implemented the igxTab component to organize or to switch between similar data sets. The tabs are placed at the top and allow for scrolling when there are multiple tab items.
Image may be NSFW. Clik here to view.
Time Picker
And, last but not least, is our Scheduling feature, the Time Picker component. With igxTimePicker, the user can select a time from a dialog with spinners. A seemingly small addition, but very useful!
Image may be NSFW. Clik here to view.
Financial Chart
Now, let’s focus on another of our flagship tools for this release: the new igxFinancialChart component. This offers developers the ability to craft lightweight, high-performance, and easily configured charts to display financial data. It boasts a simple and intuitive API for working with and binding your data or data collections. On top of that, the chart offers multiple ways in which a user can display or visualize the financial data, providing context and clarity to relevant information. If you needed any more urging to try out this control, it also intuitively and automatically analyzes and selects data columns for the user. It’ll go ahead and use the Date and Time columns for the x-axis, and the y-axis will be dedicated to Open, High, Low, Close, and Volume. If you don’t have y-axis columns specifically devoted to those titles, it’ll also pick the first five numeric columns. You can see a detailed list of the component's features on
Below, you can see an example of an automated chart:
Image may be NSFW. Clik here to view.
By including this support for OpenFin and extending our controls, we’re broadening our scope to help developers who are extensively working with primary and secondary capital market applications.
Category Chart
With the excitement from the financial chart control, it seems natural to move into our new component for visualizing category data. Essentially, igxCategoryChart simplifies the complexities of the data visualization domain into an uncomplicated API. You can effortlessly bind a collection of data, or even a collection of collections, and let Category Chart do the rest. It’ll analyze your data and then automatically select the best series for the data’s representation.
Image may be NSFW. Clik here to view.
You’ll have a variety of chart types to choose from Spline, Point, Waterfall, Line, and many others.
Virtualization
Now that we’ve seen our significant charting and Data Grid additions, we should pay mind to our other significant change: the virtualization directive. We’ve added the igxForOf directive to aid in the rendering of large-scale data sets in your applications without loss to performance. This will allow a user to smoothly scroll through big data sets and keep the application running at optimal capacity.
On top of this, the igxForOf directive can be incorporated into almost any component that needs to render the vast amounts of data, giving you considerable options when working behind the scenes with your application.
Overall, we see some super exciting features and components added to Ignite UI for Angular in this release. It’s bringing OpenFin support and functionality to address growing development trends in the financial markets space, and it’s delivering lightweight grids and charts for your data display needs. As we continue to add features and new components in an on-going basis, please make sure to check out the Ignite for UI Angular page, where you can create or use your existing Infragistics account, or pop open the command line, and get to try out these powerful features. Beyond that, you should follow us on Twitter via @Infragistics for product news and stay up-to-date with our Community Forums.
Lastly, if you have future feature requests, please submit them via our Product Ideas website.
In our 18.1 Ultimate UI for Windows Forms release, we aimed to provide the most complete Microsoft Excel & Spreadsheet solution for .NET application development.
Today, Infragistics Excel engine and Spreadsheet control features over 100 supported functions. Additionally, we have delivered updated to our Windows Forms Data Grid and Windows Forms Data Chart. Let's look at what's new.
Excel Engine and Spreadsheet Features
We'll start with the Infragistics Excel Engine which is capable of creating full Microsoft Excel Workbooks, so while using this object model, you can load, modify, and save Excel workbooks. This has been integral to our Ultimate UI for Windows Forms for some time, and it's now received a multitude of updates to provide user flexibility and ease. We'll begin with a few of the significant featured updates and then move into a brief overview of other supported spreadsheet functions.
Conditional Formatting
As you might have guessed, we can now leverage conditional formatting into the spreadsheet with this feature. The spreadsheet will now support the rendering of all conditional formatting options available in Excel. As it turns out, Excel has several predefined styles that you can use to conditionally format your data: Data Bars, Color Scales, and Icon Sets. I've respectively shown them below for reference and included a sample of what your Windows Forms spreadsheet might look like with conditional formatting.
Image may be NSFW. Clik here to view.
Image may be NSFW. Clik here to view.
Image may be NSFW. Clik here to view.
Image may be NSFW. Clik here to view.
This now opens a variety of doors for your data. If you're looking to display a simple icon, compare values, create alternating bands, or find duplicates, our Excel engine will help you out.
Worksheet Sorting and Filtering
Considering our discussion of formatting, it's fitting to move into the sorting and filtering options that have been included. Typical of any sorting or filtering function, you're looking to find information quickly and concisely within your data. While we had these functions working within a Worksheet Table, we've gone ahead and made it so that you can now sort and filter your information outside of a table. Essentially, you can define a single area, within the Worksheet, but outside of the table, and you can apply these operations. In addition to this, the sorting and filtering classes are now public. These were previously internal because the only way to specify an icon is via a conditional formatting icon set. Luckily, as you just noted above, the advent of conditional formatting has now made this possible.
Image may be NSFW. Clik here to view.
Image may be NSFW. Clik here to view.
List Validation
Often when working with repetitive and selective information, you'll find yourself turning to list data validation to help with your work. This type of data validation will either contain an explicit list of values, or it'll point to a range of cells that contain the values. So, when you have your list validation set up for a particular column, for instance, you will see a cell drop-down option that then lets you select the appropriate data from your specified list. So, why the overview? Because while we had list data validation in place, users had to know of the list's specifiers to type in the relevant data, since there wasn't a cell drop-down option. In this update, we've added the cell drop-down option for ease and functionality.
Image may be NSFW. Clik here to view.
Cell Drop-Down
To further highlight added cell drop-down functions, there's a shortcut that's frequently employed when users are inputting the same data from a list. This differs from list data validation, as you're not directly correlating a set of cells to a list of data, but rather calling up a list that implicitly uses the data that surrounds the cell in which you're working. With Windows Forms in mind, we decided to change this function slightly, since if we made this possible in Edit Mode for the Worksheet, it would have generated complications with focus handling.
Image may be NSFW. Clik here to view.
Table Improvements
There are a multitude of table improvements, so I'll underscore a few of them, and you can glance at the rest when you get a chance. The major ones to come with this update are Copy and Paste, Editing, Tab Navigation, Total Raw Formulas, and ContextMenu.
With Copy and Paste, you can now select an entire table, copy it to the Clipboard, and paste elsewhere to have a new copy of that selected table created. Also, when pasting in a Worksheet Table, the table will be automatically expanded to encompass the area of the paste function.
As for Editing, when you find yourself typing or editing immediately adjacent to the bottom or right edge of a Worksheet Table, the Table will be expanded.
Tab Navigation will navigate within the table, wrapping to either the next or previous row. Like Excel, the table will also be automatically expanded when tabbing from the last visible cell of the table.
With Total Raw Formulas, we slightly differ from Excel with our drop-down function, as Excel spawns another dialog for formulas. When you have a total row or column highlight in Windows Forms, you can select the drop-down button to pick a common formula for the table.
For ContextMenu, some additional items were added, such as menu items for inserting and adding rows/ columns to a table, selecting rows/ columns of a table, toggling the total row, and converting a table to a range.
Image may be NSFW. Clik here to view.
100+ Supported Functions
Beyond everything that we've spoken about so far, there are a number of additional popular functions supported, including SUM, CONCATENATE, and COUNTA, and a host of others through which you can easily scroll.
Grid Events
Column AutoSizing with UltraGrid
Moving from the spreadsheet features, let's discuss the two new events that were added to the UltraGrid: BeforeAutoSizeColumn and AfterAutoSizeColumn. The purpose of these events is to allow developers to modify or to override the AutoSize width of a column. We're pointing this out because it's quite useful if you're using CreationFilter or DrawFilter in a way that affects the required width of a column. CreationFilter, for instance, only affects the rendering layer, so the grid can't adjust the auto-size width. Overall, this is now a great way to add extra pixels to the width of a column, especially if you're looking to accommodate an extra element.
Data Chart Controls
Scatter Series
For our last major update, we added four new types of scatter series to the UltraDataChart control, so let's take a brief glimpse at each of them. Please note that I've linked each chart title to its page that holds more detailed information, and there's a helpful graphic below the descriptions.
Scatter Area Series: This data chart draws a colored surface based on a triangulation of X and Y data with a numeric value assigned to each point. This series is useful for rendering heat maps, magnetic field strength, or Wi-Fi strength in an office.
Scatter Contour Series: This chart draws colored contour lines based on a triangulation of X and Y data with a numeric value assigned to each point. This series is useful for rendering contour maps, changes in magnetic field strength or rendering an overlay on top of ScatterAreaSeries
Scatter Polygon Series: This one is a visual element that displays data using polygons. This type of series can render any shape that you'd like. All you need to do is bind a List of List of Point objects or load a shapefile with polygons using the ShapefileConverter
Scatter Polyline Series: And for the last one, it displays data using polylines. This scatter series is often used where rendering disconnected lines are required such as a network graph or multiple connections between scatter data points. This series has the same data requirements as ScatterPolygonSeries does, and it also can render data from shapefiles.
Image may be NSFW. Clik here to view.
In closing, we’ve walked through some impressive enhancements to our Ultimate UI for Windows Forms in this 18.1 release. We've added the most-wanted spreadsheet features and updates to its grid events and data chart controls. In continuance of your work with Ultimate UI for Windows Forms, please make sure to head on over to the product page to view all the updates or try your hand at the free trial. If you already have Ultimate UI for Windows Forms, make sure to update to the latest version. Furthermore, if you’re looking to connect and stay with us on updates, follow us on Twitter via @Infragistics or check out the Community Forums.
Shhh…. do you hear that? That’s the sound of our newest Infragistics Ultimate for WPF 18.1 being released into the wild. Like a stampede of elephants crushing everything in sight, the Infragistics Ultimate UI for WPF 18.1 release is packed with new controls and features that will give your apps the edge you need to crush your competition. By themselves, these new controls and features are beautiful, majestic, and admired by children and adults alike. Together, they are an unstoppable force that will instill fear into even the most formidable adversary.
Now, let’s tame this herd of majestic beasts and learn about all the great new controls and features shipping in Infragistics Ultimate for WPF 18.1.
Financial Chart
First up is our brand new xamFinancialChart. This bad boy is a lightweight, high-performance chart that is used to display financial data using an extremely simple and intuitive API. All you need to do is bind your data (a collection or a collection of collections), and the chart takes care of everything else.
Image may be NSFW. Clik here to view.
As you can see, the xamFinancialChart has just about everything you need to visualize your financial data. A toolbar is located above the top of the chart is used for displaying configuration options such as your choice of indicators and overlays, the date ranges, chart type, volume, and type of trendlines to use. Located on the bottom of the chart is an optional navigation view that acts as a zoom bar that allows your end-users to zoom in or out of their desired ranges.
Obviously, this is the financial industry’s dream chart.
Excel Library / XamSpreadsheet
Next up is probably the most impressive amount of work we have packed into a single component in about five years. Well technically, there are two components being improved here. First is the Excel Library and the other the xamSpreadsheet control. Obviously, we can’t add a feature to the xamSpreadsheet without the feature first being added to the Excel Library. So keep in mind, every feature you see here is available in both the Excel Library AND the xamSpreadsheet.
Conditional Formatting
Conditional formatting allows you to automatically apply formatting—such as colors, icons, and data bars—to one or more cells based on the cell value. To do this, you'll need to create a conditional formatting rule. For example, a conditional formatting rule might be if the value is less than $2000, color the cell red. By applying this rule, you would be able to quickly see which cells contain values less than $2000. Pretty basic stuff right? Well, the best part is that the xamSpreadsheet supports rendering all conditional formatting features available in Microsoft Excel. Microsoft Excel has several predefined styles—or presets—you can use to quickly apply conditional formatting to your data. They are grouped into three categories:
Data Bars are horizontal bars added to each cell, much like a bar graph.
Image may be NSFW. Clik here to view.
Color Scales change the color of each cell based on its value. Each color scale uses a two- or three-color gradient. For example, in the Green-Yellow-Red color scale, the highest values are green, the average values are yellow, and the lowest values are red.
Image may be NSFW. Clik here to view.
Icon Sets add a specific icon to each cell based on its value.
Image may be NSFW. Clik here to view.
Format Cells Dialog
One of my favorite new features added to the xamSpreadsheet is the new Format Cell Dialog. This makes it extremely easy to change how your data is displayed in a cell. For example, you can specify the number of digits to the right of a decimal point, or you can add a pattern and border to the cell. To show this dialog, just right-click the cell and select Format Cells from the context menu. Let’s take a look at what options are available in the new Format Cell Dialog.
Number Tab
Image may be NSFW. Clik here to view.
By default, all worksheet cells are formatted with the General number format. With the General format, anything you type into the cell is usually left as-is. For example, if you type 36526 into a cell and then press ENTER, the cell contents are displayed as 36526. This is because the cell remains in the General number format. However, if you first format the cell as a Currency, then the number 36526 will be displayed as $36,526.00.
Alignment Tab
Image may be NSFW. Clik here to view.
You can position text and numbers, change the orientation and specify text control in cells by using the Alignment tab
Font Tab
Image may be NSFW. Clik here to view.
The term font refers to a typeface (for example, Arial), along with its attributes (font style, point size, underlining, color, and effects). Use the Font tab in the Format Cells dialog box to control these settings. You can see a preview of your settings by reviewing the Preview section of the dialog box.
Border Tab
Image may be NSFW. Clik here to view.
In Excel, you can put a border around a single cell or a range of cells. You can also have a line drawn from the upper-left corner of the cell to the lower-right corner, or from the lower-left corner of the cell to the upper-right corner.
You can customize these cells' borders from their default settings by changing the line style, line thickness or line color.
Fill Tab
Image may be NSFW. Clik here to view.
Use the Fill tab in the Format Cells dialog box to set the background color of the selected cells. You can also use the Pattern list to apply two-color patterns or shading for the background of the cell.
Protection Tab
Image may be NSFW. Clik here to view.
The Protection tab offers you one option for protecting your worksheet data and formulas. However, this option does not takes effect unless you also protect your worksheet.
Worksheet Filtering
While we always had filtering available in the Excel Library, it only applied to filtering within a worksheet table. We have extended the filtering behavior to allow you to define a single area within the worksheet outside of a table that you can filter. As you would expect, you can filter on one or more columns of data. With filtering, you can control not only what you want to see, but what you want to exclude. You can filter based on choices you make from a list, or you can create specific filters to focus on precisely the data that you want to see. You can filter by a numeric value, text values, or filter by color for cells that have color formatting applied to their background or text.
Image may be NSFW. Clik here to view.
Not only that, but we provide some built-in filter options in our new and improved context menu:
Text Filters
Image may be NSFW. Clik here to view.
Number Filters
Image may be NSFW. Clik here to view.
Date Filters
Image may be NSFW. Clik here to view.
Custom Filter Dialog
Image may be NSFW. Clik here to view.
Worksheet Sorting
Besides adding excellent filtering support, we also improved our sorting support. The new sort menu item will just set the sort of the associated column based on the value/state of the active cell for which the menu was shown. So choosing Sort A to Z will create an ascending value sort for that column.
Image may be NSFW. Clik here to view.
AutoFilter Support
Even with all those tremendous built-in sorting and filtering features accessible from a simple context menu, we also have AutoFilter support in a worksheet table. This means that now the headers of a worksheet table, and the header cells of the worksheet level filtering region, will display a drop-down button that displays the filter-related menu. The buttons show the sort and filter state and the tooltip displays a friendly description of the filter for that column. The menu displays various options for sorting and filtering. The filter options displayed are dependent on the data types in the column as they are in excel. So you’ll see one of the number filters, text filters, or date filters available depending on the data in the table column.
Image may be NSFW. Clik here to view.
Table Improvements
Tables are ubiquitous when using Excel. Once you start using the 18.1 version of our xamSpreadsheet, you will see that we really beefed up our table-based features to make your end-users even more productive when working with tables inside the xamSpreadsheet control.
Copy/Paste
Tables will now be copied when the source selection encompasses the entire table. So select an entire table (e.g., click in a cell, press ctrl+a two times), copy it to the clipboard and then paste elsewhere and a new copy of that table is created. Pasting within a worksheet table will automatically expand the table to encompass the area of the paste.
Editing
Typing/editing immediately adjacent to the bottom/right edge of a worksheet table will expand the table (in a separate undoable operation similar to what Excel does).
Tab Navigation
Tab Navigation within a table will navigate within the table wrapping to the next/previous row. Similar to Excel the table will also be automatically expanded when tabbing from the last visible cell of the table.
Total Row Formulas
This is another one of my favorite new table features. In Excel when a cell in the total row of a table is active, a drop-down button is displayed that lets you choose a common formula for a table. It can be shown by clicking the drop-down button or pressing Alt+Down when the cell is active.
Image may be NSFW. Clik here to view.
Context Menu Improvements
To really make you productive, additional context menu items were added to allow you to manipulate the table. This includes menu items for inserting and adding rows and columns to the table, selecting the table row/column, toggling the total row, converting the table to a range, etc. The table cell context menu is similar to the cell context menu except it is displayed when the active cell is part of a worksheet table. That menu also has many new commands that relate to affecting the table.
Image may be NSFW. Clik here to view.
Image may be NSFW. Clik here to view.
Image may be NSFW. Clik here to view.
Image may be NSFW. Clik here to view.
List Validation
In Excel, you can define a particular type of data validation called a list data validation that either contains an explicit list of values or points to a range of cells that includes the values. There is an option on that validation for whether to show a cell drop-down. The data validation class has been in our excel engine for a long time, and the spreadsheet has honored using the validation during editing for a while now too, but we never showed a list, so the end users had to know the list of valid values. Now we support showing a drop-down button that will display a drop-down list of the values. It can be shown by clicking the drop-down button or pressing Alt+Down when the cell is active.
Image may be NSFW. Clik here to view.
Cell Dropdown
We have also added the ability to show a dropdown list in a cell populated with data from the values immediately above and below the active cell. One way to show this cell drop-down is via the context menu for a cell using the “Pick From Drop-down List…” item, and the other is by pressing Alt+Down. You’re not explicitly defining the contents of the list as you do with a list data validation – it’s implicitly populated based on the cells above/below in the same manner as Excel. As with Excel it ignores numerical values, stops at blanks and table boundaries, etc.
Image may be NSFW. Clik here to view.
I know that’s a ton of excellent Excel and xamSpreadsheet features to soak up, but we’re not done yet. We still have to cover the rest of the features we are shipping in Infragistics Ultimate UI for WPF 18.1.
XamDataGrid
If you’ve been a customer of Infragistics for more than a day, you know that the xamDataGrid is our flagship grid for WPF. So it should be no surprise that we continue to add significant new features to it in every release. Check out the latest features to join the xamDataGrid family.
Cell Merging
You may have seen my last post titled “XamDataGrid vs. XamGrid: Which WPF Grid Should I Choose?” in which I told you to use the xamDataGrid, and stop using the xamGrid. In this post, I acknowledged that the xamDataGrid is missing three key features; cell merging, conditional formatting, and Paging. Well, I am happy to announce that we are one feature closer to closing the feature parity gap between the xamGrid and the xamDataGrid with the addition of cell merging.
Cell merging is a common feature in Microsoft Excel that allows you to deliver data clarity and avoid duplication by merging neighboring data cells across different rows whenever they display matching values. While Excel made this feature famous, it is now a very common request in the context of showing data in a data grid. With the release of Infragistics Ultimate UI for WPF, the xamDataGrid has full support for cell merging.
Image may be NSFW. Clik here to view.
Enabling cell merging is as simple as setting the FieldSettings.MergedCellMode property. This property will control how and when cell merging is enabled. If the MergedCellMode property is set to “Always,” any set of cells in a column that have matching values will be merged regardless of their position in the column. When set to “OnlyWhenSorted,” cells will only be merged when a column has been sorted, and all cells with the same value are in a contiguous order due to the sort operation. Of course, you can always turn off cell merging by setting the MergedCellMode property to “Never,” and this is, in fact, the default value.
When you enable cell merging, by default, the cells are merged if the adjacent sibling data records display text is the same (the DisplayText value). You can change this by setting the FieldSettings.MergedCellEvaluationCriteria property. This property allows you to change the logic that is used to merge cells based on the raw value of the cells, the converted values of the cells, or even the result of the value being converted based on the EditAsType value.
Image Field
Before Ultimate UI for WPF 18.1, if you wanted to use an image in the xamDataGrid, you would have to create a TemplateField and handle all the logic for rendering your image to fit your specific application needs. While this works, it required a lot of code that had to be manually written to handle every image-loading scenario such as loading from an ImageSource, a Uri, a string, a local resource, or even a byte array. Honestly, it was a pain in the butt!
With the release of Ultimate UI for WPF 18.1, you can now use the new ImageField to render your images by just using a property in the underlying bound object and remove all that custom code from your applications. It does not matter what the source of the image is; the ImageField can handle it.
Image may be NSFW. Clik here to view.
In the following code snippet, the ImageField.Name is set to a property in the underlying model that represents how the image is loaded.
With the addition of the ImageField, we made using images in the xamaDataGrid stupid simple!
XamDataGrid Control Configurator
As you know, the xamDataGrid is a feature-rich, high performing data grid that meets the needs of demanding enterprise line-of-business applications. For new users or even seasoned veterans, the API and vast feature set can be overwhelming. With the xamDataGrid control configurator, we make it dead simple to bind your data, add your fields and field layouts, and turn the most essential features on and off with the click of a button. When you're done adding the features you want, you simply hit the "Apply & Close" button and all the code will be generated for you.
Image may be NSFW. Clik here to view.
Your next question is probably, "How do I get it?"
If you have already installed the Infragistics Control Configurators, then you don't have to do anything. The Visual Studio extension will be updated automatically via the Visual Studio Marketplace. If you haven't installed the control configurators yet, you can download and install them directly from within Visual Studio or by visiting the Visual Studio marketplace.
XamRichTextEditor New Properties
Not every control needs a large number of massive features to add value, and the newest xamRichTextEditor features prove this.
AcceptsTab
The AcceptsTab property will control the behavior of the xamRichTextEditor when the Tab key is pressed on the keyboard. By default, if you are within the xamRichTextEditor and press the Tab key, the text will be indented for each press of the Tab key. If you set the AcceptsTab property to False, the text will no longer be indented, but rather the next control with a higher TabIndex will receive focus.
AcceptsReturn
The AcceptsReturn property controls what effect the Enter key will have on the content of the xamRichTextEditor when pressed. By default, if you are within the xamRichTextEditor and press the Enter key, a new line is entered which moves the cursor to a new position, and you can continue typing content into the xamRichTextEditor. If the AcceptsEnter property is set to false, if you press the Enter key, no new line will be created, and the cursor will not change. It does nothing and will have no effect on the content of the xamRichTextEditor.
XamRibbon Improvements
The xamRibbon MenuTool has received a small, but extremely useful, feature that allows you to control whether or not the menu will close when a menu tool is clicked. Imagine you have a MenuTool with a collection of CheckboxTools that represent a multi-select scenario such as turning on supported clipboard operations as represented by the following code snippet.
The expected experience is when the MenuTool is opened, and an option is selected, the MenuTool should stay open as you choose more options. However, with this code snippet, once you check a CheckBoxTool, the MenuTool will close, and you will have to reopen the MenuTool to make another selection, and then continue this process until all desired options have been checked/unchecked.
Image may be NSFW. Clik here to view.
With the new MenuToolBase.StaysOpenOnClick attached property; you now have full control over when to close the MenuTool when an option is selected. Simply add this attached property to the tool that will keep the MenuTool open when clicked. We can modify the original code snippet with the new MenuToolBase.StaysOpenOnClick attached property to achieve our desired results.
Now, no matter how many times these CheckBoxTools are checked/unchecked, the MenuTool will not close until you click on another element in your app. You can also mix-and-match the attached property in the same MenuTool. Only the tools that have the attached property will not close the MenuTool, any tool without the attached property will close it.
Image may be NSFW. Clik here to view.
Ahhhhh... now that's a much better experience!
WPF NuGet Package Improvements
We have historically shipped WPF NuGet packages with our Infragistics Platform Installer. The installer would merely place a zip folder on your C drive that you could unzip and put in a folder of your choice that you could then use to create a custom NuGet package source in Visual Studio.
While this worked, the experience could be better. So we made it better! With the release of Infragistics Ultimate 18.1, we now place the NuGet packages in a local folder, copy all the WPF NuGet packages into it, and create the NuGet Package Source in Visual Studio for you automatically. You don’t have to lift a finger. It’s all done for you. Better yet, we also placed our Infragistics Ultimate UI for WPF 18.1 NuGet Packages on our public NuGet feed that you can use instead of your local feed. This is useful for getting updated NuGet packages more quickly.
Let’s Wrap this Baby Up!
As I always like to point out, if you have ideas about new features we should bring to our controls, important issues we need to fix, or even brand new controls you’d like us to introduce, please let us know by posting them on our Product Ideas website. Follow and engage with us on Twitter via @infragistics. You can also follow and contact me directly on Twitter at @brianlagunas. Also, make sure to connect with our various teams via our Community Forums where you can interact with Infragistics engineers and other customers.
Release notes reflect the state of resolved bugs and new additions from the previous release. You will find these notes useful to help determine the resolution of existing issues from a past release and as a means of determining where to test your applications when upgrading from one version to the next.
Release notes are available in both PDF and Excel formats. The PDF summarizes the changes to this release along with a listing of each item. The Excel sheet includes each change item and makes it easy for you to sort, filter and otherwise manipulate the data to your liking.
In order to download release notes, use the following links:
Ultimate UI for Windows Forms 2018 Volume 1 Volume Release
Starting with the April 2018 release of Ignite UI for Angular, we are shipping broader capabilities in the toolset, but more impactfully for developers we are adding key features to our Angular Data Grid, a brand new native Angular Charting component, and new additions to the Ignite UI CLI.
The Angular Data Grid now ships with Column & Row virtualization, Paging, Column level support for Filtering, Sorting, Summaries, Pinning, Hiding, Resizing, grid-level Filtering, Row Selection / Select All, and Export to Excel (XLSX, CSV, TSV).
The Angular Chart ships in 2 flavors: Business Charting (Line, Column, Area, Spline, Area, Point, Waterfall, Step Area, Step Line, Spline, Spline Area) and Financial Charting (includes Bollinger Bands and Price Channel overlays, over 25 built-in Financial Indicators, 13 Trend Lines, 4 Chart Types & 3 Volume Indicators) all preset in a convenient toolbar with built-in time based filtering.
The Ignite UI CLI supports all grid component features, chart features and the ability to add your own custom templates that can be used across your teams to amp up productivity.
In early June 2018, we are shipping a major release that ties the Design to Development story together in a big way. When we first launched our native Angular product over a year ago, we included a Sketch UI Kit which included pixel-perfect symbols that mapped to each widget in the Ignite UI for Angular toolbox. In June, we are taking this a step further, combing Sketch, Indigo Designed (our cloud-based experience for prototyping, collaboration on designs & usability studies) and our Angular controls in a complete solution for visual designers, UX designers & developers. Stay tuned as we show more of this story in the May timeframe in preparation for a June release.
Between May and July 2018, we’ll be pushing updates which continue to give you more options when using the Angular Grid & Angular Chart
Grid Multi-Column Headers / Column Groups
Grid Column Grouping (Outlook Group By interactive grouping)
Grid Advanced Filtering / Cross-Field Filtering
Dropdown / Combo Box
Pie Chart
Doughnut Chart
Radial Gauges
Linear Gauges
New Themes / Theme Samples
New and Exciting Visual Studio Code plug-ins that help to build Angular apps faster
In our Q4 October / November release, we are continuing to focus on developer productivity, not only in terms of tooling but in major controls that you need to drive enterprise apps.
Scatter Charts (including Contour, Polygon, Polyline, Area, Spline High Density)
Stacked Charts
As with any roadmap, things may shift and toggle a bit, but we are committed to continuing to deliver high value on a regular basis for the Angular developer & designer throughout 2018. If you are looking for something and don’t see it here, or have a different idea, please add/suggest anything you’d like on our Product Ideas site.
Click here for directions on how to install Ignite UI for Angular, then sign up for a free 30-day trial that includes set-up along with enterprise-ready support. Call one of our five worldwide offices to set up a product demo. We’re excited to hear what you think.
Infragistics’ Senior UX Designer, Darian O’Reilly, will kick off this year’s UXify conference with her presentation, “If Everyone is a Designer, Then Why Am I Here? Including Clients in the Design Process without Ruining the Design.”
UXify 2018: The Future of User Experience, our sixth annual, free UX conference, takes place on Friday, April 27 from 11 am – 5:30 pm, with networking from 5:30 - 7:00 pm. Lunch, snacks, and beer and wine during the networking are included.
If Everyone is a Designer, Then Why Am I Here? Including Clients in the Design Process without Ruining the Design.
By Darian O'Reilly, Senior UX Designer at Infragistics
Whether you are a freelance consultant, work at an agency, or are in-house, you have clients. If you have ever designed something for anyone but yourself, you have experienced the push and pull of creative control that exists in most design projects.
Finding the delicate balance between fostering productive client input and ending up with too many cooks in the design kitchen is a challenge UX designers regularly face. It is impossible to create a useful and elegant product solution without adequate information from our clients, but it is equally difficult to do so while having personal opinions thrust upon you about which shade of blue to use for the submit button and where to put it. Short of jumping on top of the conference table and telling your clients what you REALLY think, how can you navigate this project minefield riddled with often misguided artistic opinions?
This session will walk attendees through four important elements of the design process that when utilized properly, will create structure, provide predictability, and establish boundaries for clients while still encouraging them to make valuable project contributions.
Darian O’Reilly Darian is a Senior UX Designer at Infragistics and has been creating innovative user experiences for clients in technology, healthcare, financial, consumer and non-profit markets for over 15 years. With a degree in Sociology from Columbia University and a passion for visual design, she offers a unique perspective, applying an artistic eye to the wants and needs of the end user to create intuitive and elegant user interface solutions. She lives by the New Jersey Shore with her husband, teenage children, and three beagles.
So, you want to modernize an old desktop application by redesigning it as a modern web-based application? There is more to consider than merely the technical platform and the look and feel. To ensure that you add innovative and useful improvements to your application, follow a UX Design process.
User Experience is often defined as the overall feeling, or experience, that a person has when using a product or service, but UX is also a process for designing innovative and useful solutions. The four main steps in the UX design process are:
Research
Interaction Design
Aesthetic Design
Evaluate & Iterate (throughout both design phases listed above)
Research The purpose of the research process is to understand the design problem and to discover the business and user needs. By understanding the business needs, the users’ wants and needs, and the technical constraints, you can design a great user experience.
Image may be NSFW. Clik here to view.
The first step in the research process is to understand the business needs. Conduct interviews and workshops with business stakeholders to learn about their goals and requirements for the application.
Next, conduct user research to learn about what the users want and need. There is a difference between wants and needs. Wants are requirements that users can easily identify, whereas needs are deeper requirements that users may not be able to consciously identify. To learn what users really need, conduct observational research. Observe users performing their typical tasks in the environment in which they normally perform those tasks. Learn about the users’ characteristics, their tasks, the tools and information sources they use, and their physical and social environment. Talking with users will identify what they want, but observation will reveal deeper insights into what they really need.
Finally, in addition to learning about business and user needs, consider the technical constraints. You may think of the ideal solution to meet both business and user needs, but it has to fit within realistic technical constraints.
Interaction Design With the knowledge you’ve gained from the research phase, begin sketching out design ideas on a whiteboard. Then refine your sketches on paper, laying out the overall elements that will be on the screens, and specifying the interactions between the users and the system.
Image may be NSFW. Clik here to view.
Next, create wireframes, which are low-fidelity, black and white designs that focus on the basics of layout and interaction. Creating your wireframes in a prototyping tool, like Indigo Studio, allows you to link screens together and simulate interactions. The ability to click through a prototype makes it much easier for project team members, stakeholders, and usability testing participants to understand how the design will work.
Image may be NSFW. Clik here to view.
Aesthetic Design Early in the project, visual designers can work with the business stakeholders to learn about their vision for the design direction of the application. On our projects, visual designers create style tiles, which show different design directions that clients can choose from. Later, the chosen visual design direction can be applied to the final wireframes to create mockups that show what the actual screens will look like.
Image may be NSFW. Clik here to view.
Evaluation & Iteration Throughout the Interaction Design and Aesthetic Design phases, we continually review our designs to the clients and project team to get their feedback and to make changes, as needed. We also conduct usability testing, in one-on-one sessions with representative users. We ask usability testing participants to attempt to perform tasks in the application. If we see that many of them have problems understanding or performing certain tasks, we know those represent problems that we need to redesign.
Once we have an interaction design and aesthetic design that our clients are satisfied with and that have tested well with users, we create a design specifications document that provides the developers with all of the details they need to know to build the designs.
The Role of User Experience User experience is a design process that allows you to understand the nature of the problems to be solved. By understanding the business needs, the users’ needs and wants, and the technical constraints, you can create innovative, useful solutions.
Infragistics' webinar summary for building an enterprise Angular application with an in-depth look at the fastest Angular Data grid and components. (read more)Image may be NSFW. Clik here to view.
Infragistics is bringing its powerful 18.1 release features to the floor at Microsoft's 2018 Build Conference.(read more)Image may be NSFW. Clik here to view.
At the sixth annual and international UXify conferences held on April 27th, over 300 participants from various agencies, in-house workers, and freelancers, joined the events in the United States, Bulgaria, and Japan. The conferences were successfully built to discuss the best UX practices and to consider forward-thinking concepts based on the drives of the international community. With the focus of this year's UXify centered on the "The Future of User Experience", the speaker list was inundated with professionals from all over the UX industry, supporting a meld of innovative discussion and thought-leadership throughout the days.
The United States conference officially began with Dean Guida emphasizing that Infragistics is centered around its "passion for user experience." As the CEO and founder of the company, Dean has built Infragistics to be ultimately client-focused with its tooling and products for the web, desktop, and mobile environments. By bringing together like-minded professionals to collaborate and network, this passion was brought to a forefront for those involved at the cutting edge of the UX design community.
Each location featured its own set of highlights and exciting speakers:
UXify Bulgaria
In Sofia, Bulgaria, the participants were fully engaged and energized while hearing riveting case studies which were focused on emotional and meaningful design.
Image may be NSFW. Clik here to view.
George Abraham's keynote speech, "Detoxifying Your Prototyping Process for Better Results", intrigued the audience and instilled confidence in those looking to play a larger role in the design processes of their companies.
In other prominent talks, George Angeloff, a design leader for the popular IDIT Web based in Bulgaria, spoke about the revolution surrounding emotional design and how to design meaningful UI. This segued nicely into Svetoslav Simov's discussion around fonts and new technologies. Simov, as an owner of one of the world's most popular type foundries, Fontfabric, spoke about the history and future of fonts and typography.
Image may be NSFW. Clik here to view.
UXify Japan
In Tokyo, Japan, the primary focus of the day rested on best practices for UX design and ways to boost functionality.
Image may be NSFW. Clik here to view.
The keynote speaker, Yoshihiro Saito, lead the audience through his take on the resonations of UX design within the mind and ways to best approach standard practices. With other talks from Nakagawa Tomoko and Fukuoka Say, the day moved into topics of expanding design services to fit user experiences for various positions and ways to design UX processes around purpose and context.
Image may be NSFW. Clik here to view.
UXify US
In Cranbury, New Jersey, the talks centered on forward-thinking design strategies and the future implementation of design with the inclusion of AI and virtual reality.
Image may be NSFW. Clik here to view.
Featured speakers, like Darian O’Reilly, David Fisher, Lisa Lokshina and Kristine Malden, took to the floor with attention-grabbing thought-leadership. Darian started the event with useful ways to include clients in the design process to produce valuable project contributions and elegant final products. From there, David, Lisa, and Kristine all discussed the fascinating journey that UX design will now be taking as AI and VR come to the stage, encouraging designers to adapt to these transformational technologies as work moves forward.
Image may be NSFW. Clik here to view.
Overall, the events struck a chord with the design community, as a myriad of relevant, productive discussions stemmed from just under thirty talks spanning the globe. Moving forward, you’re encouraged to stay in touch with the design community and Infragistics, so please feel free to follow us on Twitter for the latest updates. Furthermore, you should check out Indigo Studio, our complete solution for collaborative prototyping and usability testing. It’s a code-free way to design for today’s most popular platforms for web, desktop, and mobile.
This is a big week for Infragistics. We have teams in Seattle, WA at Build 2018 and at Google I/O in Mountain View, CA. Both Microsoft and Google this week are showcasing keynotes focused on Artificial Intelligence (AI), Machine Learning (ML), Elasti...(read more)Image may be NSFW. Clik here to view.
If you don’t know what they are, how to use them, why they are useful, or what they even do, pivot tables can become scary and complex. You’ll soon find that a pivot table is a great way to quickly summarize, analyze, explore, and present your data.
ReportPlus, built by user experience experts, makes pivoting your data easy with an intuitive drag and drop experience. The pivot table is broken out into four sections: Values, Rows, Columns and Filters:
Image may be NSFW. Clik here to view.
You will see that as you start dragging fields into a corresponding section that the data being displayed will instantly update.
Values
This location is where you will drop your value field upon which you want your visualization to be built. By default, the field that you place in the values section will be summarized as a sum. If your field is a text field, ReportPlus will detect this and display your data as count.
You can see here that, by dragging Sales over to my values section, ReportPlus summarized my data:
Image may be NSFW. Clik here to view.
If a value is all you wish to display, you can display your value in the form of a gauge. By clicking on the sales field, I am prompted with options to customize the value by changing the aggregation, formatting, sorting and filtering. You have these options and more in any field that you bring over.
Image may be NSFW. Clik here to view.
Rows
This section is where you would drop the field that you want to correspond to the x-axes of your visualization. So, if I change my visualization to a column chart and drag a date field over to rows, you will see sales by month.
Image may be NSFW. Clik here to view.
Columns
Regarding the columns section, here are the fields that you would have appear in your chart legend or the columns of a table, etc.
Image may be NSFW. Clik here to view.
Filters
The filters section allows you to filter and slice your data based on a certain field. So, if I wanted to see sales by month per product, but I only wanted to see the deal types that were subscriptions, I would pull deal type over to the filters section. Then, I can click on the field to select which value(s) I want to filter by:
Image may be NSFW. Clik here to view.
To see how you can easily pivot your data in action with R+, check out this video. If you like the ease and functionality behind these pivot tables, consider taking a closer look at ReportPlus. It’s our answer to true self-service BI, allowing you to better visualize and understand your significant data for faster decision-making.
With throngs of people chattering and rampant idea-sharing in the air, Microsoft's 2018 Build conference represented the sheer eagerness attendees had regarding the futurology of tech. The Washington State Convention Center packed upwards of 7,000 attendees, ensuring that lectures and sessions would be busy, full of learning, and conversant. With Satya Nadella, the CEO of Microsoft, dominating the keynote speech, the giant crowd was witness to the overarching ideas behind the conference: responsibility in computer-learning, the advent of Visual Studio Code Live, the hallmarks of Azure, and the cutting-edge opportunities we have torevolutionize work through mixed reality. As Nadella noted, "The world is becoming a computer," and he's right.
Image may be NSFW. Clik here to view.
So, What Did We See?
Between the Expo Hall and the sessions dotting the building's landscape, major players in the industry were showcasing their newest wares and ideas. From GitHub to LinkedIn and from Docker to Citrix, there was information abound for attendees to access. With sessions held about Kubernetes, Azure, Visual Studio Code Live, machine-learning, Microsoft Graph, the HoloLens, and more, Build aimed to commandin the area of thought-leadership.
At the Infragistics booth found near the Client & Web area, we spent three successful days demoing portions of our new Infragisitcs Ultimate 18.1 release. While showing off our updates to the fastest Angular data grid, financial charts, and improved spreadsheet functions, booth attendees were able to join in on our #PinItToWinIt campaign at the Expo and on Twitter. The campaign encouraged attendees to affix the Infragistics pin, and this put them in the running to earn one of our twenty giveaway sweatshirts or our large prize, Beats headphones.
Image may be NSFW. Clik here to view.
How Were the Conversations?
The team found themselves having lengthy discussions about our high-speed Angular data grid features, showcasing the smooth rendering of large-scale data sets and the financial charting capabilities. With a healthy mix of current and new customers arriving to talk, excitement rested primarily on the power of our material-based Angular components. When not discussing Angular, many also came to explore and learn about our WPF and Windows Forms features, particularly for our work with the Excel engine updates. There was also a strong showing of those interested in our enterprise management products, with ReportPlus Embedded dominating the space due to its easy data visuals and cross-platforming.
Image may be NSFW. Clik here to view.
Where are We Going from Here?
Moving forward for 2018, Infragistics is going to set its eyes on the area of rapid application development, promoting WYSIWYG and UI kits for web and mobile app building and delivering a design-to-code workflow across Indigo Studio and Ignite UI. From this design-to-code workflow, we'll have code generation for Flutter and Angular, adding to our innovative features surrounding our Angular grid and charts components.
Image may be NSFW. Clik here to view.
Excited to Learn More?
We have an extensive list of products that make web, desktop, and mobile application development far easier and more streamlined. Since we've spoken so much about Angular recently, be sure to take a look at ourIgnite UI for Angular and the Ignite UI for Angular CLI and get to working with the fastest Angular data grid. On top of that, consider making your way to our popular enterprise management tool, ReportPlus Embedded. It enables businesses to create rich, beautiful data visualizations to accelerate ROI and to bring BI to life. Plus, if you're interested in a large-scale solution, learn about ourUltimate developer's toolkit which gives you a single platform for UX design and enterprise application development.
The more things change, the more they stay the same; this adage definitely applies to unit testing. Although we’ve advanced greatly in the world of software development, the fundamentals remain the same. Certain things like AAA, Arrange, Act and Assert will always apply, however, we must learn how to think of them within the world of Angular.
In the previous article, we discussed setting up the infrastructure needed in an Angular Unit Testing Module. So for this article, I’d like to focus on the components that make up your typical Angular Spec File and provide the implementation of the age old concepts of AAA.
In the Arrange portion of our unit test, Angular, leveraging the Jasmine unit testing library, will first describe the component we wish to test by utilizing the describe function, as illustrated below. It’s important to utilize a descriptive name, as this will make reading the results from your unit tests a lot easier.
describe('AppComponent', () => {
Moving on to the Arrange section of our file spec, we utilize the beforeEach function to initialize any configurations that will be needed across all the unit tests in the file. Unique to Angular, however, is the TestBed class, which provides the essential ingredients needed for simulating the construction and initiation of our Angular Module.
If you’ll notice, we are using the configureTestingModule method of the TestBed class to initialize our configurations. If we look at the source code, the TestBed class provides additional methods for testing that can be very useful.
As their names imply, the above methods can be used to override functionality contained within your module. This may be useful in a case where you want to provide mock data to your component, but your component is coupled with a particular provider; overrideComponent would then give the ability to pass in a fake provider service to inject the mock data.
Some additional things to take note of in the previous code snippet are the RouterTestingModule and the compileComponents function. The RouterTestingModule can be used as a substitute for the usual RouterModule and simulates route navigation without having to actually change url locations. In addition, the RouterTestingModule has a method, withRoutes, that accepts a parameter value of fake routes, which can be useful in various testing scenarios. The compileComponents function is necessary when running your unit tests with a library other than angular-cli. When using angular-cli, however, your unit test code is compiled automatically during the initialization stage.
The Act section of unit testing is where we actually setup our individual unit tests and should look similar to the code below:
  it('should render title in a h1 tag', async(() => {
    const fixture = TestBed.createComponent(AppComponent);
    fixture.detectChanges();
    const compiled = fixture.debugElement.nativeElement;
The createComponentmethod is responsible for creating a copy of the root of our component and returns an object of type ComponentFixture. The fixture of an Angular Unit Test is crucial in that it helps manage and simulate the component’s life cycle. By calling the detectChanges method, the component will detect changes in its environment and bind all of its properties. Keep in mind that our unit tests exist outside the domain of the Angular component lifecycle, therefore, in order for any change to be detected we must first call the detectChanges method.
A closer look at the ComponentFixture class reveals a property of type DebugElement.
First to notice is that the DebugElement class contains properties such as, properties, attributes, classes, styles that help streamline our unit tests by giving us a wealth of information about our component at our fingertips. The next step is the triggerEventHandler, this method is crucial for simulating DOM events that will be picked up by our component’s event listeners. Last, but not least, is the query method, by far my favorite.
Similar to jQuery, the query method is able to able to search through the DOM and return matching elements. The main difference, and advantage, in its functionality is that the return value is not merely a collection of DOM elements, but of DebugElement objects, making it easier to test nested components. In addition, the query method accepts a parameter of type Predicate<DebugElement>, meaning we can query the DOM using any of the properties found in the DebugElement class.
If that weren’t enough, Angular has provided a class called By, which has further methods to ease the construction of Predicate objects for use in our queries. Below is an illustration, taken from the Angular testing guide, of some examples of this class:
Finally, the last step of AAA, Assert, should look similar to the below:
expect(app.title).toEqual('app');
This is very similar to a typical Jasmine unit test, except we see the power of the Angular unit testing library, as we are directly accessing the title property of the component.
If you like this post, please like it and share it. In addition, if you haven’t checked out Infragistics Ignite UI for Angular, be sure to do so! They’ve got 50+ material-based Angular components to help you code speedy web apps faster.