Quantcast
Channel: Infragistics Community
Viewing all 2460 articles
Browse latest View live

HTML5 Sparkline chart that is a perfect fit for your jQuery Grid

$
0
0

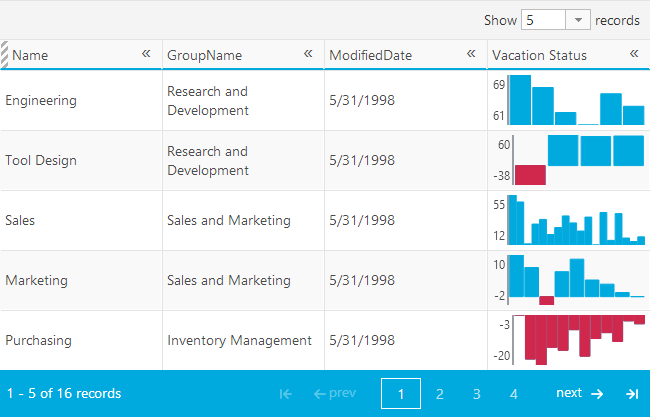
HTML5 Sparkline chart in the Ignite UI jQuery GridsSparklines are small, word-sized charts intended to fit anywhere a word or a number would, essentially packing a lot of data into minimum space, yet remaining very easy to read and analyze. After the introductory HTML5 Sparkline chart for data-intense, small-scale Data Visualization post and what seems like a long time ago when I wrote about Sparkline and Grid integration and it was for our XAML controls, I think it’s time to revisit this Sparkline in its sort of natural habitat. Since it’s lightweight and small enough to fit inline with text, inside our jQuery grids’ row should be just fine as well. Of course, there are a few points to take into consideration and I have this favorite case – using the Sparkline as a preview and for quick trend-spotting of child layout data in a hierarchical grid. I also have a few tips on improving the general experience with this control combination.

Essentials

First off though, the obligatory getting started list. There’s a very good guide in our documentation and elaborate samples too, so this blog is going to be more advanced level. You can visit the Sparkline Documentation to get started or steal some quick snippets from the Sparkline samples. Also don’t forget to check out my previous blog as I will be using some of the styling and event handling from that one.

Data requirements

As I mentioned I like to use one hierarchical data source and preview child data for each row in the chart. That means you can bind that to either a Hierarchical grid or a flat one, but take notice the latter case will require you to prevent data scheme transformation by setting the “localSchemaTransform” option to false. Another option would be using a completely separate source for the Sparkline, potentially some remote API, but still based on the grid data. Perhaps a mash up data source is also an interesting option.

Events

Adding an external control to the grid usually involves a templates and events – but which ones? Well, your options really boil down to how complicated your scenario will be – what other features are involved. From simple to complex – if you have a static grid (for whatever reason) you can use “rendered”, which fires once when the grid is loaded and that’s it. Going forth when you add some features that require re-rendering of the data (such as Paging, Sorting) “dataRendered” would probably do the trick. However, when the Column Hiding /  Responsive features kick in they wouldn’t modify the data view and you would need (“as seen on the samples”) the “rowsRendered” event which is your regular data-refreshed generic event.

Take one

Piecing together all the elements, starting with a grid definition and a template for one column to be a target. You can mark those any way you want - special format id-s, classes or nothing at all. Also make sure you pick an appropriate block display container – pretty much a DIV, rather than a span or something else that is inline. The reason behind this is that the table layout will otherwise ignore the size you set to the chart (namely height ) and cut/squish your visuals. Last but not least, consider making the column unbound (thus the schema option), rather than binding it to the child option –  in this case the template won’t be using the data anyways.

Once you have you template column, handle the event you picked from above – I’ll use “rowsRendered” to keep everything playing nice with paging, responsive mode enabled or just about anything else. Because the event’s owner is the grid you can also use the arguments to extract any information you might need about the grid and grab the data source as well. Sadly that is fired for bulk operations, so you will have to iterate and also find row id. One option is to embed the id in the container like the sample does. The default row template will also have id you can reuse:

JavaScript

  1. $('#grid').igGrid({
  2.     dataSource: '/Home/Departments',
  3.     primaryKey: 'DepartmentID',
  4.     columns: [
  5.         //....
  6.     {
  7.         unbound: true,
  8.         key: 'Vacations',
  9.         headerText: 'Vacation Status',
  10.         template: '<div class="sparky"></div>'
  11.     }],
  12.     localSchemaTransform: false,
  13.     rowsRendered: function (evt, ui) {
  14.         $(".sparky").each(function () {
  15.             var ds = ui.owner.dataSource;
  16.  
  17.             $(this).igSparkline({
  18.                 displayType: "column",
  19.                 dataSource: ds.findRecordByKey($(this).closest("tr").data("id")).Employees,
  20.                 valueMemberPath: "VacationHours",
  21.                 height: "50px",
  22.                 width: "100%",
  23.                 normalRangeMaximum: 60,
  24.                 normalRangeMinimum: 10,
  25.                 normalRangeVisibility: "visible",
  26.                 verticalAxisVisibility: "visible"
  27.             });
  28.         });
  29.     }
  30. });

MVC

  1. @(Html.Infragistics().Grid<SparklineInGrid.Models.Department>()
  2.     .ID("Grid1").Columns(column =>
  3.     {
  4.         //..
  5.         column.Unbound("Vacations").HeaderText("Vacation Qtrly balance").Template("<div class='sparky'></div>");
  6.     })
  7.     .DataSource(Model)
  8.     .LocalSchemaTransform(false)
  9.     .DataBind()
  10.     .Render()
  11. )
  12. <script>
  13.     $("#Grid1").on("iggridrowsrendered", function (evt, ui) {
  14.         $(".sparky").each(function () {
  15.             var ds = ui.owner.dataSource;
  16.  
  17.             $(this).igSparkline({
  18.                 displayType: "column",
  19.                 dataSource: ds.findRecordByKey($(this).closest("tr").data("id")).Vacations,
  20.                 height: "50px",
  21.                 width: "100%",
  22.                 verticalAxisVisibility: "visible"
  23.             });
  24.         });
  25.     });
  26. </script>

Ignite UI flat jQuery Grid with Sparkline templated column

One last thing to make you chart fit perfectly like that– make sure there’s no default padding (included in some themes). Also if you don’t want the sparklines to blend with the row background, make sure to remove theirs:

.ui-sparkline {
    background: rgba(255,255,255,0)!important;
    /*Remember to disable the Sparkline default padding when inside a grid cell*/
    padding: 0px;
}

Up your UX game

Now I’m no specialist by any measure, but I judge based on common sense and what feels right to me. So, looking at those axis values above – why do they need to constantly take up my precious space? Why not have that information available only when needed, and the rest of the time the chart can be used for trends and comparison. Tooltips come to mind, but I also consider mobile with responsive and the standard tooltips following my finger, quite possibly under it, are not too ideal. Option one would be to use the positioning trick I used in my last blog and find a better place for those tooltips. But because I also like consistency, when using the Grids tooltips in Popover mode – why not reuse those for the chart as well? So I want something like this:

Hierachical Grid with Sparkline column in a responsive mode on mobile device scene with touch-friendly popover tooltips

I shamelessly stole some storyboard scenes from Indigo Studio :)

So my favorite scenario with hierarchical data and the chart being a quick preview and what you need to do is obviously enable the Grid tooltips feature with Popover style. On a side note, with the last release the Popover actually grew into its own control, but even before that it was around as utility for the grid with almost the same API. That means that despite using the control, my demos below will work with both 13.1 and 13.2. The steps for replacing the tooltips:

  • Disable default popovers for the target columns’ tooltips to avoid overriding the content
  • Handle the sparkline’s inherited “updatetooltip” event and cancel it to prevent the chart from using it’s own tooltip. Use the argument data and trigger a popover instead.
  • Maintain the target for your popover as the chart will fire the update event multiple times and also to prevent unwanted closure of your popup by the grid
  • Optionally handle events to close the popover (it won’t hide automatically unless it’s triggered by the grid on another column). My bet is on mouse leave and touch end – the first will work for desktop and surprisingly mobile IE will emulate it as well and touch end will hide the popover on other mobile devices.

  1. $('#grid').igHierarchicalGrid({
  2.     dataSource: nwCustomersWithOrders,
  3.     primaryKey: 'CustomerID',
  4.     columns: [
  5.         //...
  6.     {
  7.         key: 'Orders',
  8.         headerText: 'Orders',
  9.         template: '<div class="sparky"></div>'
  10.     }],
  11.     columnLayouts: [{
  12.         columns: [
  13.             //...
  14.         {
  15.             key: 'OrderID',
  16.             dataType: 'number',
  17.             headerText: 'Order ID'
  18.         }, {
  19.             key: 'Freight',
  20.             dataType: "number",
  21.             headerText: 'Freight'
  22.         }],
  23.         key: 'Orders',
  24.         foreignKey: 'CustomerID',
  25.         primaryKey: 'OrderID'
  26.     }],
  27.     features: [
  28.         //...
  29.         {
  30.         name: "Tooltips",
  31.         style: "popover",
  32.         tooltipShowing: function (evt, args) {
  33.             if (toolTipState.target != args.element) {
  34.                 //reset tootlip cached target
  35.                 toolTipState.target = null;
  36.             }
  37.         },
  38.         tooltipHiding: function (evt, args) {
  39.             // prevent closing the popover when Sparkline one is visible
  40.             if (toolTipState.target) {
  41.                 returnfalse;
  42.             }
  43.         }
  44.     }],
  45.     rowsRendered: function (evt, ui) {
  46.         $(".sparky").each(function () {
  47.             var ds = ui.owner.dataSource;
  48.  
  49.             $(this).igSparkline({
  50.                 tooltipTemplate: "High: ${High} <br>Low: ${Low}<br>First: ${First}<br> Last: ${Last}",
  51.                 dataSource: ds.findRecordByKey($(this).closest("tr").data("id")).Orders,
  52.                 valueMemberPath: "Freight",
  53.                 unknownValuePlotting: "linearInterpolate",
  54.                 height: "50px",
  55.                 width: "100%",
  56.                 normalRangeMaximum: 100,
  57.                 normalRangeMinimum: 10,
  58.                 normalRangeVisibility: "visible",
  59.                 highMarkerVisibility: "visible",
  60.                 lowMarkerVisibility: "visible"
  61.             }).on("igsparklineupdatetooltip", function (evt, ui) {
  62.                 var gridCell = $(this).closest("td");
  63.  
  64.                 if (toolTipState.target != gridCell[0]) {
  65.                     toolTipState.target = gridCell[0];
  66.                     toolTipState.content = $.ig.tmpl(ui.owner.options.tooltipTemplate, ui.item);
  67.                     $("#" + ui.element.closest("table").igGridTooltips("id")).igPopover('show', gridCell, toolTipState.content);
  68.                 }
  69.                 returnfalse;
  70.             }).on("mouseleave touchend", function (evt) {
  71.                 // optionally hide the popover when user is no longer focusing the sparkline.
  72.                 // mouseleave handles desktop and IE mobile, Touchend handles mobile WebKit
  73.                 $("#" + $(evt.target).closest("table").igGridTooltips("id")).igPopover('hide');
  74.                 toolTipState.target = null;
  75.             });
  76.         });
  77.     }
  78. });

Essentially I’m using the sparkline’s own template and data item to create the content and pass it to the Popover’s show method. The rest is handling closing and current target.

The resulting Hierachical Grid with Sparkline column with touch-friendly popover tooltips with the new 13.2 styling

Tips

  • You can set/override defaults of the popover globally by extending its options:
$.extend($.ui.igPopover.prototype.options, {
    //you can override Popover defaults if needed
    direction: "top"
});
  • The Sparkline tooltip template (and therefore the argument item) accept/have 4 properties – High Low, First, Last.
  • Further improvements can be made by using optimized custom build rather than the loader. Potentially you can delegate the Sparkline tooltip update event to the grid to reduce the number of handlers, although with reasonable page sizes I don’t think it’ll be a noticeable difference. Also keep in mind the each loop is synchronous and if you’re doing many sparklines or heavy work (requests for data) consider making initializations async.
  • with 13.2 the Popover got a bit cleaner design specifically when used with the grid – loosing the borders and the small “x” in the corner. With 13.1 the above screenshot looks like this.

Resources

We’ve seen the Ignite UI Sparkline charts as a column in the jQuery Grids along with Responsive and Tooltips features enabled. I’ve covered some options that require attention and some improvements you can make. The chart's built-in tooltips are replaced with the Popovers used by the grid that are more touch-friendly. This way the app makes the best of the space it has initially, while still providing range information with through the tooltips and in-depth data by expanding the child layouts. And the best part is the sparkline can help you go through the rows and spot outliers super fast!

Donwload your Ignite UI Free Trial now!

I’d love to hear some thoughts, so leave a comment down below or @DamyanPetev.

And as always, you can follow us on Twitter @Infragistics and stay in touch on Facebook, Google+ and LinkedIn!


Infragistics Friends Group Presentation: Chrome Apps and Node-Webkit - Event Recap

$
0
0

Infragistics Friends group and jQuery Sofia with the help of Infragistics Inc.  organized a presentation on the following topic: Chrome Apps and Node-Webkit .

The event was held on Tuesday, March 11h, 2014 at Infragistics Bulgaria Office, 110B, Simeonovsko Shosse Bul., Sofia, Bulgaria.

This was a practical session how to create Chrome applications for different platforms Windows/OS X/Linux/Android/iOS

Speaker was Boris Simandoff - a software evangelist and entrepreneur, Boris is one of the co-founders of FinAnalytica, a company that was awarded as № 1 Market Risk Solution Provider in 2012. He is co-inventor and patent holder of the "Risk Management Using Heavy Tails" system. Over the past 3 years, Boris has been involved in product management for large-scale projects at Chaos Group, a Bulgarian company providing innovative rendering solutions for the global visualization industries. At Chaos Group, he leads projects related to the V-Ray Application SDK (C++/Java/.NET/Node.js/Python) and V-Ray Distributed Cloud Services. The Bulgarian Presidency awarded Chaos Group as Innovative Company of the Year 2012. @simandoff


This presentation covered:

  • What are Chrome apps
  • Advantages of Chrome Apps
  • Difference between Web and Chrome App
  • Architecture Lifecycle


  • Chrome APIs
  • Manifest Permissions
  • NODE-Webkit
  • And many demos…


Simandoff just before the presentation


Boris is talking about the manidest.json in Chrome apps.


An Example how to wrap web app like “Google Maps


Questions – on the picture below – Gencho Chokoev – owner of the one of the Bulgarian ERP vendors


The presentation area – Infragistics Bulgaria office.


Some of attendees


At the end – pizza and discussion with the speaker.


A chromebook – new opportunity for developers - a challenge with chrome apps


Special thanks to Boris Simandoff for the awesome presentation and to Laptop.bg for the opportunity to have one of the first chromebooks in Bulgaria!


Notes from the presentation on "Chrome Apps and Node-Webkit" are available here:


As always, you can follow us on Twitter @mihailmateev and @Infragistics and stay in touch onFacebook,Google+andLinkedIn!

What to do with UX Findings and Recommendations

$
0
0

audience2

Usability testing and expert reviews are both great methods to discover design and usability problems, but it can be overwhelming to receive a deliverable with a long list of problems and recommendations. You can’t fix everything at once, so you may wonder where to begin. Should you focus first on the easy items to fix, or should you try to tackle the most serious problems, even though those require a lot more time and effort?

In this post, I’ll provide advice for project teams in how to best receive and implement usability testing and expert review recommendations.

Provide Enough Time for Analysis

Unless you’re on a tight deadline and need to get the findings as soon as possible, allow the UX professional enough time to do the analysis and prepare the deliverable. Thorough analysis and thoughtful recommendations take time. Rushing to get the deliverable finished with an unrealistic deadline will result in lower quality findings and less thought-out recommendations.

Make Sure Everyone Attends the Findings Presentation

It’s important for everyone on the project team to attend the presentation. Although they could read the report or presentation later, that doesn’t provide the same impact as hearing the findings firsthand. A live presentation provides more context around the findings and allows everyone to ask questions.

Ensure that the Deliverable Provides Enough Detail

Insist on receiving a detailed deliverable. It doesn’t have to be formal or fancy, but it does need to be detailed enough that you’ll be able to clearly understand the problems and recommendations later, when it’s time to implement them.

If the only deliverable you receive is a presentation, it’s especially important to ensure that it will make sense when you read it later. Presentations usually include limited and abbreviated text to avoid being too wordy, which is great for presentation purposes, but that often makes them difficult to understand later. If you only receive a presentation, ensure that it’s understandable when read on its own.

Findings and recommendations deliverables normally provide prioritized findings (high, medium, and low), based on the severity of the problems. Those are usually based on the UX analyst’s professional judgment. That’s useful information, but you still have to do your own prioritization of the issues in terms of how they impact your business and prioritize them based on how you’re going to address them.

Don’t Get Defensive

Although you’ll probably hear about some positive aspects of the interface, the purpose of usability testing and expert reviews is to find problems. Sometimes they reveal a lot of problems, which can feel negative and critical. If it’s your design, it’s natural to feel a little defensive, but don’t let that lead to you dismiss or minimize the findings. Think of it as constructive criticism, and listen with an open mind. Instead of dwelling on the problems, think instead of the opportunities you have to improve the design by implementing the recommendations.

Meet to Discuss the Recommendations

After the presentation, take some time to digest the findings and recommendations, and then meet with everyone on the project team to walk through the recommendations and prioritize which ones to focus on first based on:

· Severity of the problem for the users – how much does it impact their ability to accomplish their goals?

· Severity of the problem for the business – how much does it impact business goals?

· Ease or difficulty of fixing

It’s tempting to only implement the easy recommendations, but that usually only leads to small improvements. The most severe problems are usually the hardest to fix, requiring a major redesign. If you find that you have to make major changes, you could make the easy changes first to the existing interface and then begin work on the redesign.

Conduct User Research

If you do find that you need to do a major redesign, the usability testing or expert review findings will provide a good start, but they won’t give you all the information you need to design an effective user experience. You’ll need to have a better understanding of your users and their tasks, which you can’t get through usability testing alone. Lack of understanding the users and their needs in the first place is probably what led to many of the problems you’re trying to correct.

To get that understanding, conduct user research to learn about your users’ characteristics, needs, and context of use. Go to your users and observe them performing their usual tasks in their own environment. Seeing what people do is far more reliable and provides more comprehensive information than simply asking them what they do.

Conduct Iterative Usability Testing

Even after you’ve implemented the recommendations, you should test again to ensure that the changes have fixed the problems and haven’t caused any other problems. Usability testing is best when it’s done iteratively – in several rounds of design, testing, redesign, testing, redesign, etc.

Have a Plan

If you don’t have a plan of how you’ll handle findings and recommendations, problems often don’t get solved. A usability test or expert review is only the beginning. Finding problems is usually easy, but designing the right solutions is the hart part. If you have a plan for how to address the problems you’ll find, you’ll be closer to implementing the right solutions.

Image of presentation courtesy of Derrick Coetzee on Flickr under Creative Commons license.

The Infragistics World Tour is Kicking Off in Houston!

$
0
0

If you haven’t heard already, Infragistics is kicking off our World Tour next week, starting with Houston, TX on 3/21! 

Myself, along with UX pro Jared Potter of Sixth Ave Studios, and our very own CMO, Dave Mendlen, will be heading out into the wild to bring you a FREE cutting-edge design and development workshop!

Come join us at Microsoft Houston, where Jared will teach you how to take charge of the modern design process, with a particular focus on modern web apps in ASP.NET. By the end of this half-day event not only will you have witnessed an application go from inception to design to creation, but you’ll walk away with the source code too!

For more information or to register, click here - hope to see you there!

Exclusive Interview: Dave Mendlen, Infragistics CMO

$
0
0

We recently had the chance to chat with Dave Mendlen, Chief Marketing Officer of Infragistics, before he joins forces with Jared Potter of Sixth Ave. Studios and hits the road on our World Tour. Dave and Jared will be bringing you a free, cutting-edge design and development workshop, with US stops in Houston, San Francisco and NYC, with more international dates later this year.

Read on to learn more about the World Tour and learn more about how design and development go hand in hand:

So, a World Tour! How did that come about?
Jared and I have known each other for a little while and when I found out that he was as passionate about helping developers understand design as I was, we knew we had to team up. It’s rare to find someone who is amazing at design and who also has written code. Jared is that rare find. He gets how developers think and he is able to translate his deep knowledge of design to developer-speak and that’s critical. I’m watching this epic shift in application development – the “battleship grey” apps that we used to build are no longer good enough. Our customers have apps with amazing experiences at home on their iPhones, iPads and android devices and now they expect the apps they use at work will be as engaging. And that’s going to require new skills. So, we thought let’s take our message and this training around the world.

What do you hope attendees will take away from these workshops?
I think the most important thing to take away is that while we can’t teach you to be an artist, there is a science and rules with great design. And developers are good at following rules – so if you follow the rules that Jared will walk through, your apps will be significantly better from a design perspective.

Why is it so hard to build a great app that looks good?
I think one of the greatest problems here is that developers don’t prototype the app (especially mobile apps). And what happens is a design that seems logical but then information layout and flow problems get discovered after the app is finished. Also, the users tend to react too late to the look and feel of the experience and the re-work is either deemed too hard or too costly.

What’s the best and worse user experience you’ve seen lately?
I think one of the coolest user interfaces I’ve seen lately is Word Lens – the idea is simple. Point your iPhone at a word in another language and see it in English. Amazing and clean. I saw a customer app recently that had 4 toolbars on the top of the screen and then additional navigation on the left and right side of the screen. It was a cockpit in the worst possible sense.

To register or learn more about our upcoming World Tour dates, visit our Events Page– we’ll see you there!

IgniteUI ASP.NET MVC Scaffolding Support

$
0
0

With the introduction of Visual Studio 2013 it has become quite easy to generate CRUD code in your ASP.NET MVC app with just a couple of clicks. The scaffolding support is also seamlessly integrated with Entity Framework. There are numerous resources which give a detailed overview of the new scaffolding support; here are a few of them:

http://www.asp.net/visual-studio/overview/2013/aspnet-scaffolding-overview

http://www.codeproject.com/Articles/685210/CRUD-Operations-Easy-with-New-Scaffolding-Feature

One of the little secrets behind scaffolding is that it uses T4 templates that can be modified both globally, as well as per project, and this makes the feature very flexible – for instance, we can generate Ignite UI specific Views which render an Ignite Grid for the “List” operation, instead of the standard template. I’ve done just that, and would like to give you a short overview about how it works and how you can use it in your projects.

Once you’ve created your ASP.NET MVC project, you need to create a CodeTemplates folder, and paste the contents of C:\Program Files (x86)\Microsoft Visual Studio 12.0\Common7\IDE\Extensions\Microsoft\Web\Mvc\Scaffolding\Templates

there. Now you’re ready to modify the default templates. The following article gives an overview of this customization process, which is pretty straightforward:

http://weblogs.asp.net/imranbaloch/archive/2013/09/15/customizing-the-asp-net-mvc-5-web-api-2-scaffolding-templates.aspx

Now, locate the MvcView => List.t4 file, and edit it with the following contents:


<#@ template language="C#" HostSpecific="True" #><#@ output extension=".cshtml" #><#@ include file="Imports.include.t4" #>
@using Infragistics.Web.Mvc

@model IQueryable<#="<"+ ViewDataTypeName +">" #><#@ include file="Header.cs.include.t4" #><p>
    @Html.ActionLink("Create New","Create")</p>
    @(Html.Infragistics().Grid<IQueryable<#="<"+ ViewDataTypeName +">" #>>().Width("100%").RenderCheckboxes(true).Features(features =>{
                features.Sorting();
		features.Updating();}).DataSource(Model).Virtualization(true).VirtualizationMode(VirtualizationMode.Continuous).Height("500px").DataBind().Render())<#@ include file="Footer.cs.include.t4" #><#@ include file="ModelMetadataFunctions.include.t4" #>

As you can see, our template is completely agnostic to the data model, there is nothing hardcoded there. You can, of course, make this contents whatever you prefer - you can enable features, add extra markup above and below the grid, etc. 

Now, whenever you select the “Add => New Scaffolded Item…” dialog and choose your data model class, instead of some plain HTML, you will see an Ignite Grid on your page, without the need to copy/paste or manually create any View markup. 

I am also attaching a working project. The only prerequisite is that you have the Adventure Works database installed, since I am using it in the sample. Also please make sure to select “Enable NuGet package restore”, so that any dependencies that you don’t have in the GAC are automatically downloaded and installed by NuGet (this can be done by right-clicking on the VS solution and selecting this from the context menu).

Updated the Custom IGGridView DataSource article to include Xamarin.iOS

$
0
0

We here at Infragistics love getting customer feedback, and on one of my recent articles I wrote up a sample on how to make a custom datasource helper for the IGGridView.  Well someone asked if we could rewrite it in Xamarin.iOS.    

So I wrote it up and updated the article with a second sample.

IGGridView : Using a custom datasource helper to swap rows and columns (Objective C / Xamarin.iOS)

If you have a request for a feature in our frameworks, please let us know and we will see what can be done. 

Questions about a feature?  Hit us on the NucliOS Forums.

And if you have a request for a how to article for the NucliOS product you can tweet it to the @Infragistics feed or myself @DarrellKress17 and we will see if we can write that up for you.


By Darrell Kress

NucliOS Release Notes - March: 13.1.285, 13.2.164 Service Release

$
0
0

Introduction

With every release comes a set of release notes that reflects the state of resolved bugs and new additions from the previous release. You’ll find the notes useful to help determine the resolution of existing issues from a past release and as a means of determining where to test your applications when upgrading from one version to the next.

Release Notes: NucliOS 2013 Volume 1 Build 285 and NucliOS 2013 Volume 2 Build 164

ComponentProduct ImpactDescriptionService Release
IGChart FrameworkBug Fix

On iOS 7.1, the color of some charting elements could appear as a grayscale color.

Note: The issue has been resolved and all colors will appear as expected.

13.1.285,13.2.164

By Torrey Betts


Testing Web Applications with Selenium - Tips and Tricks

$
0
0

When it comes to testing web apps, there are usually two main types of tests that we write – unit tests, which cover very specific parts of our JavaScript / server-side logic, and scenario UI tests, which cover everything and involve simulating real end user interactions.

The nature of web apps is such that we cannot cover everything with unit tests, and we rely a lot on our scenario UI tests to catch regressions and ensure quality. Over the past couple of years, we’ve tried many different frameworks which provide an API for real-world simulation/interactions using mouse & keyboard, but Selenium has really become the de-facto standard when it comes to testing UIs. It’s worth mentioning that the new WebDriver Selenium 2 API is what everyone is using (or should use) – I do not recommend relying on Selenium 1 (RC) for your tests. There are different implementations of the API for multiple platforms and browsers – including a JavaScript and PhantomJS implementations, so it makes it a very flexible and powerful testing framework. We have thousands of Selenium tests that execute with every build, and produce stable and reliable test outcomes.

In this blog post, I’d like to list some tips and tricks from the trenches that could help you save some time and make your UI tests a bit more reliable and robust. I’m going to use the .NET (C#) WebDriver API for my examples, but the same API calls should be easily applicable / translated to any other platform. 

1. Using waits

In a rich web app things usually happen asynchronously, that’s how a Hi-Fi UI functions - it’s not just about animations, but also about the dynamic nature of your screens – whenever you move your mouse, click on inputs, and perform drag and drop interactions, there is always some js code that is being executed, and in a lot of cases remote XHR requests are made, and the page uses setTimeout/setInterval/requestAnimationFrame in order to update the DOM.

The most obvious way of “waiting” until some processing is done is to use Thread.Sleep() in your Selenium Test code. This has a couple of major drawbacks – first, it is always guaranteed to cause the thread to sleep for X milliseconds. Second, it is not guaranteed that the processing will be finished in X ms, so that your test code can execute safely (for instance you may want to check if a dynamic element is present on the page, etc.). WebDriver has a great solution for that which basically boils down to using the WebDriverWait class. What WebDriverWait does under the hood is to poll your query every 500ms, and return once the wait condition is satisfied. This is called an “explicit” wait, and you can also put a max threshold in order to avoid having locks and infinite waiting for something that will never happen. An example of using WebDriverWait to check that there is no loading indicator visible on the page:

WebDriverWait wait =new WebDriverWait(driver, TimeSpan.FromSeconds(10));
wait.Until((d)=>{return(bool)((RemoteWebDriver)d).ExecuteScript("return $('#"+ id +"_container_loading').is(':visible') !== true;");});

Another way of avoiding Thread.Sleep() when finding elements is to use Implicit Waits, which means that whenever you invoke FindElementBy or just FindElement(..), it will implicitly wait / poll until the element is found. It will return null if the maximum wait time passes. 

Note that implicit waits need to be explicitly configured; otherwise the default max poll time is 0. In order to configure implicit waits, you can call this once in your setup initialization code:

driver.Manage().Timeouts().ImplicitlyWait(new TimeSpan(0,0,10));

Then whenever you do things like:

IWebElement element = driver.FindElementByCssSelector(cssSelector);

The element specified by “cssSelector” doesn’t have to exist immediately in the DOM.

2. Locating elements

As demonstrated in 1. , there are several ways to find elements on the page. One thing to always keep in mind when doing this is that from the time you assign your IWebElement reference, to the time you use it somewhere, it may already have a different location in the DOM, or be actually removed/recreated in some way. If this happens, you will get the nasty StaleElementReferenceException from Selenium. Example:

IWebElement container = driver.FindElementByCssSelector(containerSelector);// some animation happens which attaches container to a different parent in the DOM
container.DoSomething();// StaleElementReferenceException

The following link explains in detail the various reasons which may lead to this situation:

http://docs.seleniumhq.org/exceptions/stale_element_reference.jsp

(The code is Java specific but it basically has the same or similar naming it C#).

In order to avoid StaleElementReferenceExceptions, you may simply re-query and reassign the element reference, in case there is a scenario which may alter the state of the DOM for particular element references. 

3. Sending keyboard input

There are basically two main ways you can send text to input elements with Selenium. One of them is to just set the “value” property of editable elements by executing JavaScript using ExecuteScript() / ExecuteAsyncScript(). The second one is to use the SendKeys() API and really simulate user key presses. The difference is actually huge. The first approach may be more suitable if you just want to fill in some fields and don’t care about DOM events being fired and real-time character-by-character validation taking place. For instance you may just want to fill in a form and submit it. The second approach is much closer to what a real end user would do – first focus the field by pressing TAB or clicking on it, then send each letter one by one to the input field. It “gives” your app the chance to fire DOM events, perform js validation by handling those events, etc. Also, you can either send the complete value as a string using SendKeys(), or you can also send it character by character, and have some wait time between that – depending on what works best for your scenario. Here is a SendKeys() example: 

editor.Click();
WebDriverWait wait =new WebDriverWait(driver, TimeSpan.FromSeconds(10));
wait.Until((d)=>{return(bool)driver.ExecuteScript("return $('#"+ id +"').igCombo('hasFocus')");});
Actions builder =new Actions(driver);
builder.SendKeys(text).Perform();

Note that here we’re also having some custom code that waits until our widget receives focus, before we try to send any text to the input. For the case of a simple input element, you won’t need this, but in case there is a “delay” in the way you handle focus/blur, such checks come in handy. 

4. Executing JavaScript code

There are two main ways to execute JavaScript code in the context of your WebDriver test code. The first one is using the synchronous ExecuteScript(), which means that the next “line” of test code won’t be reached and executed until the script execution returns. The second way is using ExecuteAsyncScript(), which won’t block your test code. Depending on the scenario, you may be better off using ExecuteScript(), especially when your test logic which follows the JS execution depends on it. The return type of ExecuteScript may vary depending on what your script actually returns. Selenium tries to do some good conversions where it can, for instance if your script returns a list of DOM elements, it will be returned as a ReadOnlyCollection<IWebElement>; if it returns boolean true/false values, it will be the true/false C# equivalents, and so on.

It’s important to keep in mind that if you expect your ExecuteScript() call to return some value that you want to use, you should always have a “return ;” pattern, or you should call a function that actually returns something. 

5. Doing Drag & Drop Interactions

The most convenient and robust way to perform drag and drop interaction using WebDriver is to use its Action Builder API, and the “DragAndDrop” and “DragAndDropToOffset” methods. The first one accepts a source and a target element as parameters, while the second one moves the source element by an X and Y offsets. Here are two examples:

Actions actions =new Actions(driver);
actions.DragAndDrop(header, groupByArea).Release().Perform();
builder.DragAndDropToOffset(colHeader, offsetX, offsetY).Release().Perform();

You can also do a more low-level drag and drop implementation by executing all the mouse actions that are taking place one by one, again using the Actions class. For instance you can chain calls to ClickAndHold(), MoveByOffset(),  and Release(). But for 99 % of the cases, DragAndDrop/ DragAndDropToOffset should work perfectly fine. 

6. Switching between windows and iframes

The easiest way to change to a particular iframe/window is to execute:

driver.SwitchTo().Frame(frameElement); //IWebElement

Or (for window): 

driver.SwitchTo().Window(handle); // where handle is a member of driver.WindowHandles

And then to switch back to the main window in the case of iframes:

driver.SwitchTo().DefaultContent();

Note that after you change the window or iframe, any method that you call on the driver after that will be executed in the new context, until you switch to a different iframe / window. 

7. Using drivers for multiple browsers

When you use the driver API, you should always refer to it using the RemoteWebDriver class, regardless of which browser you use to run your tests. A good practice is to describe your environment in a text/xml file – such as the browser(s) you’ll be using for tests – then parse this and return the correct driver instance (for example ChromeDriver, or InternetExplorerDriver). This will make your tests independent of a particular browser driver class. Example:

switch(browser){case Browser.Chrome:returnnew ChromeDriver(chromeOptions);break;case Browser.InternetExplorer:returnnew InternetExplorerDriver(options);break;// and so on}

8. Detecting if a particular framework is loaded

In most cases your web app will have at least a couple of javascript frameworks loaded, and the DOM initialization will depend on those frameworks, so usually you will need to wait for those to load before you can execute any actions on the page. This is quite obvious if, for example, you need to run some script which uses this framework’s API, in order to check for elements existence. Here is an example which shows how you can wait for jQuery to load before you do execute any WebDriver calls:

WebDriverWait wait =new WebDriverWait(driver, TimeSpan.FromMilliseconds(maxTimeout));try{
        wait.Until((d)=>{return(bool)((RemoteWebDriver)d).ExecuteScript("return typeof $ !== 'undefined';");});}catch(Exception e){
        Assert.Fail("Couldn't load jQuery, probably there is an error in your test page: "+ e.Message);}

9. Handling context menu interactions

There is a very easy way to perform right clicking on an element using WebDriver’s API:

Actions builder =new Actions(driver);
builder.MoveToElement(element).ContextClick(element).Perform();

You can additionally chain extra commands after the ContextClick, for instance clicking on a menu item, or doing KEY UP / KEY DOWN interactions, for instance:

builder.MoveToElement(element).ContextClick(element).SendKeys(Keys.ArrowDown).Perform();

On a side note, I’d like to clarify that it’s not mandatory to call Build() once you chain more than one action, because calling Perform() will call Build(). 

10. Cleaning up

When your test suite finishes, it needs to close the browser window(s) and free any resources that were used by the web driver instance. There are several methods that you can use in WebDriver’s API – Close(), Quit(), and Dispose(). The difference may not be that obvious, but basically Quit() will close all your browser windows, Close() will close the current one, while Dispose() basically calls Quit() and has the same effect. When there is only a single browser window opened, Close() will have the same behavior as Quit() / Dispose().

In a lot of cases, you need to run many tests and reuse the same browser window(s) before they are closed. Therefore, it may be more convenient to write some utility code or shell script that performs the cleanup externally (not even using WebDriver’s API).  


We're Coming to a City Near You!

$
0
0

With its new World Tour, Infragistics is excited to take the show on the road, beginning with this week!

[youtube] width="560" height="315" src="http://www.youtube.com/embed/p0bfniGDkeo" [/youtube]

Along with Jared Potter of Sixth Ave. Studios, we’re headed to Houston, San Francisco, and New York City to show you how easy it is to incorporate design and user experience into your everyday development work. Step by step, we’re going to walk you through how to build modern, engaging web applications in ASP.NET using our tools, and you’ll even get the source code too!

The World Tour kicks off this Friday the 21st at the Microsoft Conference Center at Briar Lake Plaza in Houston, Texas. Next we hit the Microsoft Conference Center on Market Street in San Francisco on Monday the 24th, and then we'll be in Times Square in NYC on May 8th.

For more info, or to register, check out our Events Page - we can’t wait to see you there!

Scheduling UI for Ignite

$
0
0

You may have probably wondered why we still haven’t brought to you a full blown Scheduling/Calendar solution for Ignite. Well, there are a couple of reasons for this – one of them is that we’d like to make sure we focus on the best of breed feature rich LoB and DV components first – such as Grids and Charts. But more importantly – it’s because there are a number of existing jQuery plugins that can be easily extended in order to provide some good scheduling support, which will probably satisfy a lot of your scenarios.

One such widget is FullCalendar, and after looking at it I was really impressed by the features it has. In this blog post, I am going to demonstrate how you can easily extend FullCalendar’s styling and functionality in order to make it look and function like it is a part of Ignite UI. 

There are three main areas I’d like to cover – styling, data binding and additional functionality – custom dialogs, selection, deleting of events, etc. The styling part refers to adapting FullCalendar to the rest of the Ignite toolset – that is, we would like to make its look and feel the same, and we will achieve this using the jQuery UI theming support.

The Data Binding part is about different ways to bind calendar events to FullCalendar and what the data objects structure should be, including binding it to data from the $.ig.DataSource component.

The custom dialogs are about adding extra UI around FullCalendar, which will allow us to edit appointments by double clicking on them, as well as create a nice dialog UI for adding new appointments (events). This also includes creating and editing existing appointment/event objects and persisting them through $.ig.DataSource. In addition to that, I’ve implemented UI for selection and removal of existing events from the calendar views. 

Styling

Let’s start with styling. If you look at the default FullCalendar styles, you can see they are different from the styles of the new Ignite Theme, and simply putting it on a page with other Ignite components doesn’t look very nice. Example (FullCalendar on the left, Ignite Grid on the right):

Luckily, FullCalendar has great support for jQuery UI styling, and it applies classes like ui-state-default, ui-state-active, ui-widget-header, and so on – in the rendered markup. And because Ignite UI is fully jQuery UI CSS compliant, this means that we can automatically apply our Infragistics CSS, and it should take effect. Indeed, this turns out to be a piece of cake – we only need to add the Infragistics.theme.css style reference in order to make it happen:

<head><linkrel='stylesheet'href='../css/themes/infragistics/infragistics.theme.css'/><linkhref='../css/fullcalendar.css'rel='stylesheet'/><linkhref='../css/fullcalendar.print.css'rel='stylesheet'media='print'/><script src='../js/jquery.js'></script><script src='../js/jquery-ui.js'></script><script src='../js/fullcalendar.js'></script>

And we get the nice Ignite-friendly FullCalendar look and feel:

Additionally, you can change the background color of the event/appointment boxes, by editing the fc-event-* set of CSS classes.

Data Binding

FullCalendar supports several different data formats:

 – You can define events inline, for example:

events:[{
		title:'All Day Event',
		start:newDate(y, m,1)},{
		title:'Long Event',
		start:newDate(y, m, d-5),
		end:newDate(y, m, d-2)}]

-  You can provide a URL string which will be queried and need to return data in a similar format:

events: "/api/eventlist"

which returns an array of objects that have a title, start, end (optional), and url (optional) properties.

What’s really cool about FullCalendar is that you can specify multiple event sources using the eventSources option – moreover, those can have mixed types, for instance the first event source may be a JSON array, while the second may be a URL. You can also specify different colors for the events/appointments from those multiple sources. 

- You can also set events to point to a function that, once executed, should return an array of event objects. What’s nice about this approach is that it can be called multiple times, whenever FullCalendar needs events data (this also depends on the value of the lazyFetching property). The function basically accepts a start and end parameters, and calls the callback parameter whenever the events, which fall into this range, are generated/obtained from the data source. 

Additionally, when you bind FullCalendar to an URL, and lazyFetching is enabled (default), FullCalendar will only request events for the currently visible UI – for instance the current day, week or month. It will pass a start and end parameters to the URL, and it’s responsibility of the server-side logic to handle these params. 

Having said all of the above, $.ig.DataSource can come quite handy when it comes to data binding data to FullCalendar. Since it has out of the box filtering support, and also supports multiple data formats, we can make use of it in order to hide some of the complexity required to normalize and filter the data. 

Example – binding using a function (the complete sample is attached to this blog post):

var dataSource =new $.ig.DataSource({
	dataSource: data,// list of event objects
	schema:{
		fields:[{name:"title", type:"string"},{name:"start", type:"date"},{name:"end", type:"date"},{name:"allDay", type:"bool"},{name:"url", type:"string"}]}}).dataBind();

$('#calendar').fullCalendar({
	theme:true,
	defaultView:"agendaDay",
	header:{
		left:'prev,next today',
		center:'title',
		right:'month,agendaWeek,agendaDay'},
	editable:true,
	events:function(start, end, callback){// we may also query a remote URL here, passing the same filtering expressions
		dataSource.filter([{fieldName:"start", expr: start, cond:"after"},{fieldName:"end", expr: end, cond:"before"}],"AND");
		callback(dataSource.dataView());}});

Custom Dialogs and extra functionality

There are two main types of dialogs I would like to cover – creating new appointments, and editing existing ones. We can basically achieve both of these features with a single custom dialog. FullCalendar does not provide UI for adding/editing/removing events. There are a couple of basic samples with browser prompts but they are quite basic. On top of that, we would like to support some validation for our dialogs. 

In order to achieve the above, let’s start by examining the hooks FullCalendar provides – for instance, we can use a “select” event handler and open a dialog from it. The handler will be invoked any time we click on a day/month/week slot:

select: function(start, end, allDay) {

    // custom logic to open a dialog for a new event goes here

},

When it comes to editing existing events, we need to bind to the “eventRender” event that FullCalendar fires for every event, and bind a click/dblclick handler to the event element. Here, I would like a custom UI modal dialog to appear once I double click on an event:

eventRender:function(event, element){
	element.bind('dblclick',function(){<logic goes here>});},

Now let’s write the markup for our custom dialog first. I’d like to make use of our igDialog as well as our numeric/date and text editors, in order to save tons of time. Here is the markup for my dialog template:

<divid='eventdialog'><div><labelclass="label">Title: </label><inputclass="title input"/></div><div><labelclass="label">Start: </label><divclass="startdate input"></div></div><div><labelclass="label">End: </label><divclass="enddate input"></div></div><div><label>All Day Event</label><inputtype="checkbox"class="allday"/></div><divclass="buttons"><buttonclass="okbutton ui-state-default">Save</button><buttonclass="cancelbutton ui-state-default">Cancel</button></div></div>

Basically, I have labels and inputs for the Start date, End date, Title, and AllDay event values. I also have two buttons – Ok and Cancel. Validation will be done whenever Ok is clicked.

I’d like to make the title input mandatory, and the Start & End date date editors with custom format – where values can be incremented with a spin button in 30 minute intervals. This is very easy to do, here is the initialization logic for my editors:

$(".title").igEditor({
	required:true,
	validatorOptions:{
		required:true}});
$(".startdate").igDateEditor({
	dateDisplayFormat:"HH:mm",
	dateInputFormat:"HH:mm",
	button:"spin",
	spinDelta:30});
$(".enddate").igDateEditor({
	dateDisplayFormat:"HH:mm",
	dateInputFormat:"HH:mm",
	button:"spin",
	spinDelta:30,
	validatorOptions:{
		errorMessage:"End Date cannot be earlier than Start Date"},
	minValue: $(".startdate").igDateEditor("value")});

Note that I am adding additional validation logic to the start and end dates, such that we don’t end up with an appointment which has the Start Date greater than the End Date.

After this is done, we can initialize our igDialog itself:

$("#eventdialog").igDialog({
	state:"closed",
	modal:true,
	draggable:true,
	resizable:true,
	height:350,
	width:400,
	headerText:"Add/Update Event"});

Because the allDay property may be both true/false, as well as undefined, we’d like to make sure we track whether it has been enabled through the UI, or whether it’s undefined:

$(".allday").click(function(event){
    $("#calendar").data("allDayUserSet",true);});

Now let’s go back to our “select” and “dblclick” handlers, and fill them in, so that we open our dialog for adding and editing events:

select:function(start, end, allDay){// set the initial values
	$('#calendar').removeData("originalEvent");
	$(".startdate").igDateEditor("value", start);
	$(".enddate").igDateEditor("value", end);
	$(".allday").prop("checked", allDay);
	$(".title").val("");
	$("#eventdialog").igDialog("open");},

Since need to keep track of the event we’re editing – whether it’s an existing one or not, we want to make sure we remove this reference if we are actually adding a brand new event. Also, we are filling the editors by taking the start/end/allDay event parameters that FullCalendar passes.

And for editing existing events:

eventRender:function(event, element){
	element.bind('dblclick',function(){
		$("#calendar").data("allDayUserSet",false);
		$(".startdate").igDateEditor("value", event.start);
		$(".enddate").igDateEditor("value", event.end);var isAllDay = event.allDay || event.end ===null;
		$(".allday").prop("checked", isAllDay);
		$(".title").val(event.title);
		$("#calendar").data("originalEvent", event);
		$("#eventdialog").igDialog("open");});
	element.data("eventId", event._id);}

Note that we consider an allDay event to be an event which either has allDay set to true (explicitly), or an event which doesn’t have an “end” date set.

Now the only thing we need to do is implement what happens when someone clicks on the OK and Cancel buttons:

Cancel is really easy, we don’t add & persist anything, just close the dialog:

$(".cancelbutton").click(function(){if(!$(".ui-state-error").is(":visible")){
		$("#eventdialog").igDialog("close");}});

Note that if there are errors on the page, because of failed validation, we don’t want to close the window until those errors are corrected.

Now some of the more important snippets from the OK part – the complete code is in the attached sample:

First, obtain the event data from the dialog:

var start = $(".startdate").igDateEditor("value");var end = $(".enddate").igDateEditor("value");var title = $(".title").val();

and so on. Then, perform validation:

$(".title").igValidator("validate");
$(".enddate").data("igDateEditor").options.minValue = start;
$(".enddate").igDateEditor("validate");

Then we need to find the existing event in our data source, in case we are editing an already added event. Remember, we are reusing the same dialog for both editing and adding new events. If we are updating an existing event, we can then just call:

$('#calendar').fullCalendar('updateEvent', originalEvent);

where originalEvent is the originalEvent with updated start/end/allDay properties. Note it’s important that we actually find this original event and don’t pass a new object with those property values. That’s because FullCalendar uses the _id internal property in order to match data. 

Remember that since we’re binding to $.ig.DataSource, we want to update it through the API as well, so that we get nice transactions recorded – they can be later used to make an AJAX call in order to persist our event data to a database:

dataSource.updateRow(i,{
	allDay: allDay,
	start: start,
	end: end,
	title: title},true);

In case we are adding a new event, we do:

$('#calendar').fullCalendar('renderEvent',{
		title: title,
		start: start,
		end: end,
		allDay: allDay},true// make the event "stick");

And then also add the data through the dataSource’s API:

dataSource.addRow(events.length,{
	allDay: allDay,
	start: start,
	end: end,
	title: title},true);

Finally, we can close the dialog, if everything is ok. Here are a couple of screenshots of this awesome functionality in action:

Editing an existing event by double click:

Validation:

Now, let’s enable selection. This is quite easy to do, actually. We just need to add the following code to our eventRender logic:

element.bind("click",function(){
	$(".fc-event .fc-event-inner").removeClass("ui-state-hover");
	element.find(".fc-event-inner").toggleClass("ui-state-hover");});

What we get is this:

Now since we have a special style applied to the selected event (appointment), let’s add some logic to be able to delete it by pressing the DELETE keyboard key:

$("body").keydown(function(event){if(event.keyCode ===46){// remove eventvar confirmRemove = confirm("Do you really want to remove this event?");if(confirmRemove){
			$("#calendar").fullCalendar("removeEvents", $(".fc-event .ui-state-hover").closest(".fc-event").data("eventId"));}}});

Quite elegant and powerful. And all of this works for any view – Day, Week, Month.

We can add many more extra features to the scheduling story, and it would be great if you can share your thoughts with us, so that we can better prioritize. 

2014 User Group Contest

$
0
0

Have you heard about the 2014 User Group Contest? Check out Brian Lagunas' blog post and spread the word - let's make this year's contest better than ever!

[youtube] width="560" height="315" src="http://www.youtube.com/embed/7XMgFwMnZvE" [/youtube]

Ignite Grids – Performance Tips and Tricks

$
0
0

In this blog post, I would like to briefly outline some basic guidelines that can help you dramatically increase the page load speed and decrease the rendering time for the Ignite Grid components. We already have a performance guide which is part of our documentation, but I would like to extend on it, as well as talk about some new features that weren’t originally present when the performance guide was developed. This is where you can find the original guide:

http://help.infragistics.com/Help/Doc/jQuery/2013.2/CLR4.0/HTML/igGrid_Performance_Guide.html

I will try not to repeat things that are already covered in the guide.

Optimizing the Initial Page Load

Let’s start with the more basic things first. When you load a web page, there are several main things that you need to be concerned with:

  • What’s the size of my requests – i.e. am I downloading a 10k thing or a 10MB thing
  • How many requests am I making
  • How many of those are data / scripts / CSS / images, etc.
  • Am I using any optimizations on the server, such as gzip,  in order to compress data 

This is all related to optimizing your initial page load. If you don’t do that, it will make little difference if your 1000 records in the Ignite Grid load for 100 or 1000 milliseconds, because the overall page load experience will not be good. So how can we improve that before we focus on the more specific aspects of performance? Well, there are a couple of straightforward solutions:

  • Use combined and minified versions of the Ignite Scripts and CSS
  • Avoid using the $.ig.loader component
  • Only include the scripts that you will actually need. For instance, do not reference infragistics.dv.js in case you don’t use any of the Data Visualization components
  • Use sprites for your own images. For example, this is a really great site which generates a sprite image and the corresponding CSS for you, when you input a list of icons/images:

http://instantsprite.com/

  • Think about ways to avoid loading resources that aren’t immediately needed. Instead, try to load them on demand. For instance let’s say you have a tabbed home UI, and different tabs require different scripts to be loaded. You can use RequireJS in order to load modules on demand when users change the tabs. This has trade-offs, of course, because you don’t want your tab switching to get dramatically slowed down. If your resources are large enough to generate more than a 100-200 ms delay, it is probably better to put a nice loading indicator on your home page and load those resources upfront.
  • Enable gzip compression on the web server. This optimization alone can easily make your payload 40-50 % smaller. If you’re using Apache, this can be done in the following way:

http://httpd.apache.org/docs/2.2/mod/mod_deflate.html

If you are using IIS, this can be done in the following way:

http://blogs.msdn.com/b/vivekkum/archive/2009/02/18/http-compression-in-iis-6-and-iis-7-using-service-account.aspx

http://www.iis.net/configreference/system.webserver/httpcompression

There are also a number of ways to enable dynamic compression in IIS (as opposed to compression for static content). It’s outlined in the second URL above. 

For a node.JS app, enabling gzip can be done in a pretty straightforward way:

http://nodejs.org/docs/v0.6.0/api/zlib.html#examples

  • Load your (minified & combined) Javascript/CSS resources from a Content Delivery Network (CDN). Some popular recommended CDNs include:


    • Amazon CloudFront
    • MaxCDN
    • Google Cloud Storage
    • Windows Azure CDN 

  This has the advantage that end users will retrieve the resources from the fastest/closest location to them, and will offload your primary servers.

Optimizing Data Transfer

The next thing you may look at is what kind of data your app transfers, once the page is already loaded. This is not so much about the compression and data format, but about the structure and contents of the data. For instance, you should not send data that you won’t need on the client. Let’s say your grid has 4 columns, and none of them are hidden. But you bind to data which has objects that have extra properties - this can dramatically increase your JSON payload, and transforming / filtering the data before sending it on the wire can help a lot with respect to that. An easy rule of them is not to use autoGenerateColumns in a production environment, to begin with. This not only guards you from sending lots of unnecessary object properties, but also saves time because the grid doesn’t have to analyze its data source in order to infer column types, keys, etc. Also, if you are using some Entity framework on the server, do not bind directly to auto-generated types, but instead create your own, simple types which only include properties that will be sent and used / rendered in the grid. For instance, let’s say you have an Order entity. You can simply create a class with the following properties:

public class Order

{

   public int productID { get; }

   public int quantity { get; set; }

   // possibly other properties

}

And then bind an IQueryable<Order> to the grid’s DataSource. (In case you use the ASP.NET MVC wrappers). 

The same guidelines apply for the hierarchical Grid, but there you have one other aspect – layout generation – which can be even costlier than column generation for a flat grid. So in case you are in a production setup, it is not advisable to enable automatic generation of hierarchical grid layouts, because this may not only increase the rendering/ initialization time, but also cause your app to transmit a huge extra payload that you will never render or access from your client-side logic. 

Optimizing the Grid Rendering

Last but not least, I would like to mention some ways to speed up the grid’s own rendering. Let’s talk about width and height first. When you set a height or a width for the grid, it has to do extra calculations in order to ensure everything is perfectly aligned – columns, headers, etc. In case fixed headers are enabled, this has an additional overhead on the rendering because the markup is split into two tables – the one for the fixed headers area, and the one for the data records. Those tables are also wrapped with additional divs, so that scrolling is synchronized and works out of the box. There are tons of small things that we are taking into account in order to have all of this functionality work great out of the box. And, inevitably, this could affect performance. So, in case you do not need width/height because you are putting the grid in a container which is scrollable anyway, you don’t need to set those. Also, if you can go without fixed headers, that’s also one way to speed up the rendering. Mixing column width unit – like pixel based columns and percentage based columns can also have a negative effect on performance because of the extra checks and reflows that need to be done in the DOM. The same applies when you set width to only some of the columns. 

One of the best ways to speed up records rendering is to use virtualization. There are two types of virtualization – fixed & continuous. I recommend using continuous virtualization, because you won’t need to deal with issues related to different row heights, for instance. Also, continuous virtualization works great in scenarios like group-by and hierarchical grid. You need to keep in mind that when you have virtualization enabled, you still have all of your data on the client – if it’s millions of rows, data transfer/bandwidth may become a bottleneck. In that case, you should combine server-side paging with client-side virtualization in order to be able to load millions of records. Sometimes simply loading too much JavaScript objects (data records) in the browser, without rendering them in the DOM, may dramatically increase memory consumption.  

When you use filtering, prefer advanced filtering mode in case you have a lot of columns. Any scenario where you render many columns may slow down your grids if there are specific features enabled – Filtering, Updating, multi-column headers, etc. This is because those features always render extra DOM in every column header, and when this DOM turns out to be a full blown widget – like an igEditor that is used to filter a cell, it can significantly affect the rendering time. 

Setting autoFormat to true for a column is also something you should be careful with, because it will render date and number columns according to predefined formatting rules, so that the data renders nicely. 

I’ve already talked about autoGenerateColumns and autoGenerateLayouts, but one extra thing that you should also keep in mind is that if autoGenerateColumns is true (default), and you don’t have a defaultColumnWidth set, and you have some manually defined columns, then when your grid renders, you may end up not even seeing the extra auto-generated columns. So you will think that the grid correctly renders only the columns that you’ve defined, and that they have correct widths, but since autoGenerateColumns is true, it will generate and append the extra columns to the columns collection, and they will be rendered with 0 runtime width. 

Primary keys also play an important role in grid’s performance, and when you can, you should always set the primaryKey option to some unique field from your data model (you can additionally hide this column). If you don’t set it, the grid will need to auto-generate a key, which will slow down things a bit. This gets a lot worse in a scenario where you have persistent selection of records. In that case, if there is no stable primary key to refer to, the grid will try to calculate checksums for the record values, in order to infer the mappings. 

Last but not least, keep in mind that when you use the ASP.NET MVC wrapper, even if you have paging enabled, you may still end up selecting all records for your query from the database and transferring them to the server-side logic of your app. In order to avoid that, you may bind using LINQ, in that case the grid will automatically set the parameters in the LINQ query, making your filtering and paging requests really fast. You won’t keep more data than you need to. 

Displaying a Date Axis in an iOS Chart

$
0
0

A date axis is essential when it comes to displaying date-based data in a chart. Often times you don't really need an actual date axis to show dates; you can simply display date strings as labels. This is a good approach when you simply want to provide a description for your data points and don't care that the distance between all the points is identical, even though the time span between those points isn't. However, that's not a true date scale.

When using a date scale, the distance between the points matters. If you plotted the first day of every month in a year on a date scale, you would expect the time span for January to be a bit larger than for February. 

In this post I will talk about creating a date axis using IGChartView and NucliOS. IGCategoryDateTimeXAxis is a special kind of a category axis that acts more like a numeric axis. It's typically used with series that show continuous data, such as line/spline/area type series.

As a side note, a column series doesn't usually make a good fit for a time axis. Columns normally have a fixed width. On a date scale that width suggests that each column has a start and end date, even though we probably meant to have a column represent one particular point in time. Besides, seeing random clusters of columns overlapping each other may not be the prettiest sight.

So, let's create some data and throw it into the chart. First, let's define a simple object model for our data.

@interface DataModel : NSObject
@property (nonatomic, copy) NSString *label;
@property (nonatomic, retain) NSDate *date;
@property (nonatomic) CGFloat value;

-(id)initWithValue:(CGFloat)value date:(NSDate*)date label:(NSString*)label;

@end

And now for the actual data:

-(void)prepareData:(int)numberOfPoints
{
    NSDateFormatter *formatter = [[NSDateFormatteralloc]init];
    [formatter setDateFormat:@"MMM dd"];    

    for (int i=0; i    {
        CGFloat value = arc4random()%10;
        NSTimeInterval month = 3600 * 24 * 30;
        NSDate *date = [NSDatedateWithTimeIntervalSinceNow:month * sqrt(i)];
        NSString *label = [formatter stringFromDate:date];
        DataModel *item = [[DataModelalloc]initWithValue:value date:date label:label];
        [_dataaddObject:item];
    }
}

The data is random, with each consecutive point happening after a shorter time interval.

Let's also define a couple of items in our view controller, such as the chart, the data source helper and an array to hold our data.

@interface ViewController : UIViewController<IGChartViewDelegate>
{
    IGChartView *_chart;
    IGCategoryDateSeriesDataSourceHelper *_dsh;
    NSMutableArray *_data;
}
@end

Now, let's set up our chart with a line series and a pair of axes.

- (void)viewDidLoad
{
    [superviewDidLoad];    

    _data = [[NSMutableArrayalloc]init];

    [selfprepareData:10];

    _dsh = [[IGCategoryDateSeriesDataSourceHelperalloc]initWithData:_datavaluePath:@"value"andDatePath:@"date"];
    _dsh.labelPath = @"label";

    _chart = [[IGChartViewalloc]initWithFrame:CGRectInset(self.view.frame, 20, 20)];
    _chart.delegate = self;    

    IGCategoryDateTimeXAxis *xAxis = [[IGCategoryDateTimeXAxisalloc]initWithKey:@"xAxis"];
    xAxis.extent = 80;
    xAxis.labelOrientationAngle = 90;
    xAxis.displayType = IGTimeAxisDisplayTypeContinuous;    

    IGNumericYAxis *yAxis = [[IGNumericYAxisalloc]initWithKey:@"yAxis"];
    yAxis.minimum = 0;
    yAxis.maximum = 10;    

    IGLineSeries *series = [[IGLineSeriesalloc]initWithKey:@"series"];
    series.xAxis = xAxis;
    series.yAxis = yAxis;
    series.dataSource = _dsh;
    series.thickness = 5;    

    [_chartaddAxis:xAxis];
    [_chartaddAxis:yAxis];
    [_chartaddSeries:series];    

    [self.viewaddSubview:_chart];
}

You can see that our view controller conforms to IGChartViewDelegate protocol. This gives us access for a bunch of handy methods and I'm going to use one of them to give the date labels a nice format. Also, note that the data source helper primarily uses the value and date properties of the data model, yet we're also setting a labelPath property. Doing so is necessary in one special case. By default the time axis will be broken down into constant time intervals, but what if you wanted to show a label under each of the data points? You can change the axis display type to Discrete and the chart will pull the labels from labelPath, while using the dates to create the scale.

Here's the final piece that formats the axis labels.

-(NSString *)chartView:(IGChartView *)chartView labelForAxis:(IGAxis *)axis withItem:(NSObject *)item
{
    if ([item isKindOfClass:[NSNumberclass]])
    {
        NSNumber *yAxisLabel = (NSNumber*)item;
        return [yAxisLabel stringValue];
    }    

    if ([item isKindOfClass:[NSDateclass]])
    {
        NSDate *xAxisLabel = (NSDate*)item;
        NSDateFormatter *formatter = [[NSDateFormatteralloc]init];
        [formatter setDateFormat:@"MMM dd"];
        return [formatter stringFromDate:xAxisLabel];
    }    

    if ([item isKindOfClass:[IGCategoryDatePointclass]])
    {
        IGCategoryDatePoint *point = (IGCategoryDatePoint*)item;
        return point.label;
    }    

    returnnil;
}

The result can be seen in this screenshot:

DateTimeAxis

And here's what the axis would look like with a discrete display type:
DateTimeAxisDiscrete

You can also download the project file to see the complete code here: UsingDateTimeAxis.zip

You will need NucliOS to be installed on your machine, which you can get here

By Max Rivlin

Microsoft BUILD - Will You Be There?

$
0
0

Infragistics is headed to San Francisco next month for Microsoft Build - will we see you there? If you'll be at the Moscone Center from April 2-4, be sure to stop by booth 314 and say hi!

 Build 2014

We'll be raffling off a 27" Planar touchscreen monitor at 6PM on Thursday - be sure to stop by during the show and enter to win!


jQuery Book (jQuery 2.0 Development Cookbook) - From newbie to experienced developers

$
0
0


I am very excited to share my impressions from the newest book about jQuery - jQuery 2.0 Development Cookbook)

The first few chapters provide a great introduction to jQuery.  The later chapters of the book cover sections on jQuery UI, jQuery Mobile and making jQuery Plugins by extending the platform.

This jQuery cookbook is appropriate for any kind of web developer even for developers with experience with web applications. Some guys who just learning web development will be able to get this book and match the theory to the practical examples. Experienced developers can use this book as a source of jQuery knowledge – The last few weeks I often associate to my cases from the book. The point is that there are solutions in this jQuery Book that everyone will benefit from.
The most important - there are a lot of practical examples from real life cases - this is the reason to say- this book is useful.

I really think you will love this jQuery 2.0 Cookbook, head over to Packt Publishing now to either get a paperback or get instant access via Ebook: JQuery 2.0 Development Cookbook .


I’d like to say “Thank you” to Packt Publishing for the 10 E-books that will be provided for the Azure Bootcamp Bulgaria attendees. The event was held on 29 of March n the Infragistics Bulgaria office.


As always, you can follow us on Twitter @mihailmateev and @Infragistics and stay in touch onFacebook,Google+andLinkedIn!

Azure Bootcamp Bulgaria - Event Recap

$
0
0


For the first time in Bulgaria Azure Bootcamp was held on March 29, 2014 at Infragistics Bulgaria office: 110 B, Simeonovsko Shosse Bul., Office Floor II ans III , 1700 Sofia, Bulgaria.  The event was organized by the local Windows Azure society, Infragistics Friends (BI and. Net Geeks), Infragistics and Microsoft.   Infragistics Bulgaria and Microsoft Bulgaria did a lot to be done the first Windows Azure  (Microsoft Azure) conference in this region.


What us Azure Bootcamp

  • One day deep dive class to help thousands of people get
    up to speed on developing Cloud Computing Applications
    for Windows Azure!
  • Sessions and training should be delivered by influential and respected Windows Azure
    professionals


This boot camp is also  part of the Global Azure Bootcamp .   There were 138 locations registered in 57 countries and 137 cities.  Infragistics is a global sponsor of the Azure Bootcamp and organizer and host of Azure Bootcamp Bulgaria

At the 2014 Global Windows Azure Boot Camp, thousands people joined online by participating in our Global Event, supporting cutting edge diabetes research at the same time. There was a charity lab using Windows Azure ( Microsoft Azure ) helping the diabetes research. 

The Windows Azure ( Microsoft Azure ) training will help IT specialists to start using faster Microsoft’s cloud technologies.


Some statistics:

  • One-day event in Sofia, Bulgaria
  • 224 registrations
  • 20 sessions (lectures and training),
  • 4 Tracks
  • 15 speakers from four countries ( Estonia, Macedonia, Ukraine and Bulgaria)


Special thanks to Jason Beres (VP of Product Management, Community and Evangelism @ Infragistics) and Ventsy Popov Developer Platform Evangelist @ Microsoft Bulgaria) who helped me with everything to organize and coordinate the conference.


Virtual meeting with Azure Bootcamp Japan in Tokyo


Ventsy Popov from Microsoft – Azure Bootcamp Bulgaria Keynote


Infragistics volunteers


Sessions…


Windows Azure (Microsoft Azure) Training…


ICB – one of our sponsors


The raffle..


Winners from the Infragistics raffle – Azure Bootcamp Japan


Azure Bootcamp Bulgaria has a great website created by Damian Petev, Technical Evangelist @ Infragistics – www.azure-camp.eu  There's also a Facebook event page .


If you want more information about the event feel free to contact the Event Admins at mmateev@infragistics.com

Follow this event on Twitter with hash tag  #WindowsazureBG, and get news on all our events with #gwab .

You can learn more about Azure Bootcamp Bulgaria if you follow us on Twitter @mihailmateev  and @Infragistics and stay in touch on Facebook, Google+, LinkedIn and Infragistics Friends User Group !


Warm Regards,
Team Azure Bootcamp Bulgaria


iOS - Objective-C - Finding Unique Values in an NSArray

$
0
0
Did you know that the NSArray class has a way of allowing you to easily find any unique values within it. In today's post i'll walk you though how to achieve this. Lets first assume we have an array of data that looks like this: NSArray* data = @[@"Apples", @"Oranges", @"Grapes", @"Apples", @"Bananas"]; Looking at the array, we can see that value: "Apples" appears twice. So how do we find only the unique values in our array. Well...(read more)

Custom IGChartView Labelling (Objective - C)

$
0
0

Why are we here?

When showing data in the IGChartView, a common question is how can one format the data for the axis labels.  So I threw together a little sample on how to use the IGChartViewDelegate

-(NSString)chartView:labelForAxis:withItem method and change our axis labels.

The Delegate

The code to set up the delegate is pretty simple. We simply define a new object* that will contain our delegate methods and implement one of the methods.

@interface MyCustomChartDelegate : NSObject
@end
  -(NSString *)chartView:(IGChartView *)chartView labelForAxis:(IGAxis *)axis withItem:(NSObject *)item
{
  // We need to filter out that we are looking at the Y-axis. I know in this case that my Y axis has
  // a key value of "y".
  if([axis.key isEqualToString:@"y"])
  {
    NSNumber* num = ((NSNumber*) item);
    NSNumberFormatter* formatter = [[NSNumberFormatter alloc]init];
    NSString* longString = [formatter stringFromNumber:num];

    // I want to make any number > 1000 into a "k" denomination, so if the string is 4 or more characters then clip it, add a k and return.

    if (longString.length > 3)
    {
      NSString* subString = [longString substringToIndex:(longString.length-3)];
      subString = [NSString stringWithFormat:@"%@%@",subString,@"K"];
      return subString;
    }

    return longString;
  }

  // Since we are overriding this method we also need to handle the X - axis labels. Since
  // IGLineSeries is a CategorySeries and the x - axis is the category axis in this case, we can
  // cast the item to a IGDataPoint and return the label.
  //IGDataPoint* pt = (IGDataPoint*)item;
  //return pt.label;

  // But just doing that isn't any fun. So instead lets get the underlying data object and make a better label.

  IGDataPoint* pt = (IGDataPoint*)item;

  IGColumnSeries* colSeries = (IGColumnSeries*)chartView.series[0];

  MyDataClass* dataObj = (MyDataClass*)[colSeries.dataSource objectForDataPoint:pt inSeries:colSeries];
  NSString* firstInitial = [dataObj.firstName substringToIndex:1];

  return [NSString stringWithFormat:@"%@. %@", firstInitial, dataObj.lastName];
}

Now for our delegate we chose to format both the X and Y axis values. On the X axis, instead of just using a single field off the data object to provide the label, we combine two fields. In this case we strip out the first initial of one of the employees and make a better identifying name for the Category. For the Y axis, we convert longer number strings to a more compact format.

A side by side comparison of how the chart would look 

That's about it.  I attached the sample projects in Obj-C and Xamarin.iOS so please download it and check out how the delegate is being used.  As this is using the NucliOS IGChartView if you need trial that can be downloaded here : Infragistics NucliOS Trial.

IGChartViewDelegate Sample Code (Objective C)

IGChartViewDelegate Sample Code (Xamarin.iOS) - Coming Soon!

If you have a request for a feature in our frameworks, please let us know and we will see what can be done. 

Questions about a feature?  Hit us on the NucliOS Forums.

And if you have a request for a how to article for the NucliOS product you can tweet it to the @Infragistics feed or myself @DarrellKress17 and we will see if we can write that up for you.


By Darrell Kress

Releasing Update 5 for Indigo Studio

$
0
0

In this update we released a much requested feature to support scrolling inside containers. But we did not stop there. We also added more project management features for you to organize the files in your project from within Indigo Studio.

Managing files inside your Project

In prior versions, the project folder structure could not be edited when viewing the project home/gallery. It was not all bad because we did allow users to create sub-folders when saving their new designs.

Project Folders

With this update, we added functionality for you to create/move/delete folders from project home. If you work anything like us in the Indigo Studio team, we are constantly iterating on our prototypes/designs. Furthermore, we tend to organize our work according to sprints. So it's quite handy that we can quickly create folders in our project to organize design deliverables into folders and name them after sprints. And just as easily drag and drop screens to move them between folders when our release plans change. Naturally, you can also have nested folders.

Drag and Drop support in Project Home

The best part about it is that we dynamically update the navigation links.What this means is that you can have a prototype that has screens placed in different folders. Indigo Studio takes care of this even when you rename folders and hunts down any navigation interactions that need updating.

Editing Containers as Groups

Containers helps users quickly organize UI elements into visual blocks. We made some changes to how containers are edited, which in a way is related to another feature we released today--scrolling in container.

Long story short, containers are now edited as groups. As in, double clicking a container or hitting the enter on a selected container now enters edit mode. The biggest peace of mind this offers is that anything added in this mode will most definitely be added to the container. This can be especially useful when adding UI elements that are bigger than the container bounds. We also show a breadcrumb navigation that helps with editing nested containers.

A nested container with breadcrumb navigation

You must be wondering how it affects the ease of dragging and dropping elements inside the container, like before. No worries; we still support that but with a twist. When you try to drag a UI element into the container (when not in edit mode), you will see a drop invitation based on your mouse cursor position. Just hold down the SPACE key to add it to the container.

Drop invitation on containers

A positive side-effect of this approach is that you can use the container to now clip large images. Simply add a large image to a smaller container, and voila, clipped image. Reposition the image as you please. Mind you, we are not saying image cropping is not on to-do list. Just that you can use containers to achieve the same end goal for now.

Special Select for Nested Elements

We mentioned the use of SPACE key modifier to add elements to the container. The SPACE key can be used in concert with your mouse cursor to do a Special Select. Special because with this approach you can select any element that's nested deep. You will find it useful to quickly change properties of some elements without wanting to enter a full editing mode. This can also be used to edit elements inside groups. To move elements out of containers, Space + Select a nested element and drag it out to move it out.

Scrolling in Containers

We had at least two goals when we approached this design task. As much as possible we wanted to support direct manipulation as opposed to adding more properties and options to achieve this. And secondly, we wanted to offer a good design time experience so that you can see what content is viewable and what's below the container fold. We drew our inspiration from how we tackled scrolling for the screen itself where we introduced the concept of canvas and viewport. To get scrolling on screens, our approach is to resize the canvas using the adorner on the bottom right.

Adjusting Container's Canvas

Scrolling in containers works the same way! When in edit mode of the container, grab the corner and resize it. This immediately shows you the container viewport that matches the physical dimensions of the container itself, and the container-canvas. When you exit the edit mode, voila, scrollbars! If you want to set a specific scroll position, while in the edit mode, move/position the visible area to what you want to show.

Other Visual Tweaks

  • Project Home Layout We moved the date information to a different position so that the screen names don't get clipped, especially for longer ones

Improvement to Project Home Gallery

  • Alt+ Click Search Suggestions We felt the icons shown in the search suggestions was bit smaller than preferred. We bumped the size up to match the sizes in the UI elements area of the toolbox. Hope that helps.

Alt+ Click visual tweak

We are working hard towards another grand version of Indigo Studio, and we are confident you are going to be quite pleased! Something to do with design reuse... shhh! May be I said too much.

How to Get This update?

Here's how to update the version of Indigo Studio installed on your machine:

  • If you have the option to automatically check for updates on startup checked, you should see a dialog box pop up when you launch Indigo. Simply click update, and Indigo Studio will do the rest. This is the easier approach.
  • If for some reason you chose not to automatically check for updates, go to MENU > HELP & ABOUT and use the "CHECK FOR UPDATES" option. Checking for Updates

About Indigo Studio for Interaction Prototyping

Don't have Indigo Studio? Download a free 30-day trial which will let you try all of the prototyping goodness.

Download Indigo Studio

Looking to suggest improvements and new ideas for Indigo Studio?

Submit a new idea

If for some reason you are having trouble with Indigo Studio, check out our help topics, forums or contact support.

Get Support

Follow us on Twitter @indigodesigned

Viewing all 2460 articles
Browse latest View live